Multi-Variable Comparison & Correlation Plot (MVCCP)
Checked variables will have their figure shown below. Uncheck any variable to remove its plot from below.
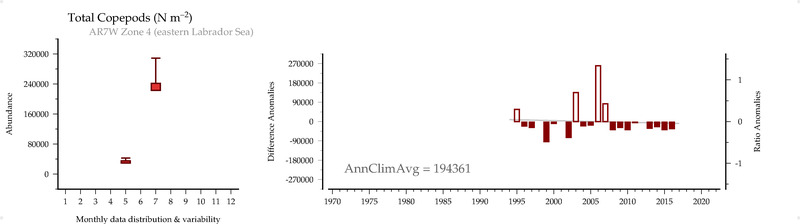
Total Copepods (#/m2)
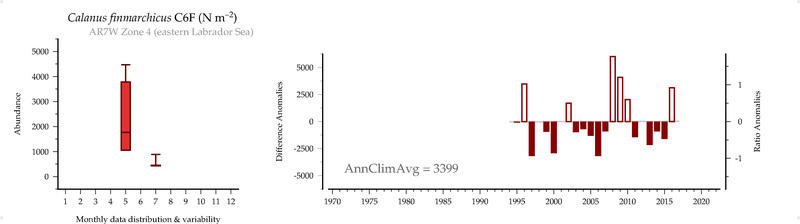
Calanus finmarchicus C6F (#/m2)
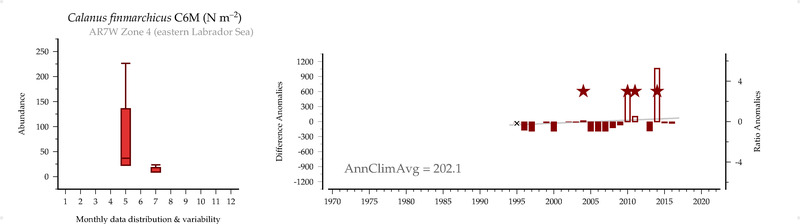
Calanus finmarchicus C6M (#/m2)
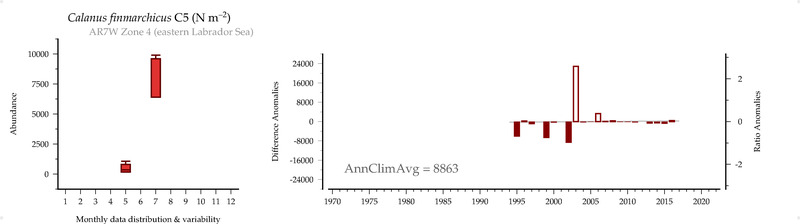
Calanus finmarchicus C5 (#/m2)
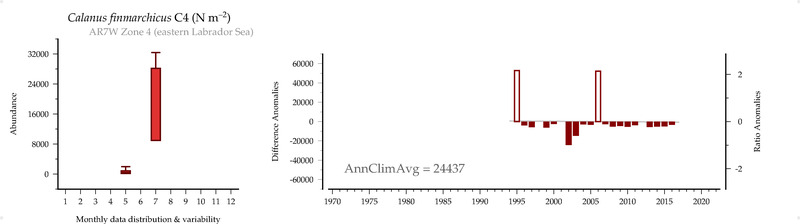
Calanus finmarchicus C4 (#/m2)
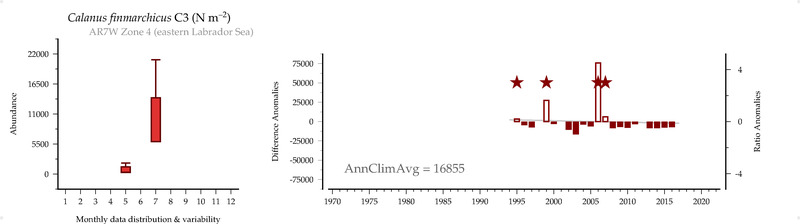
Calanus finmarchicus C3 (#/m2)
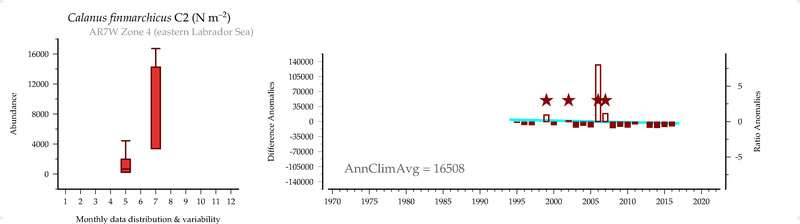
Calanus finmarchicus C2 (#/m2)
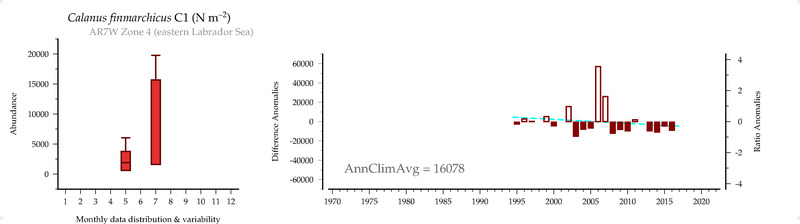
Calanus finmarchicus C1 (#/m2)
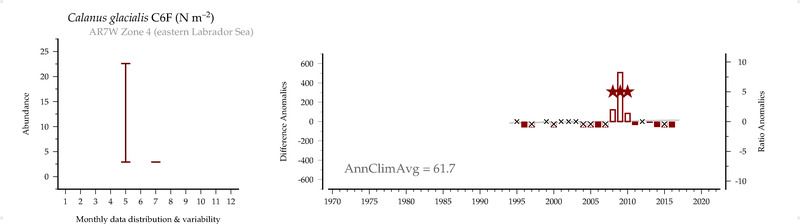
Calanus glacialis C6F (#/m2)
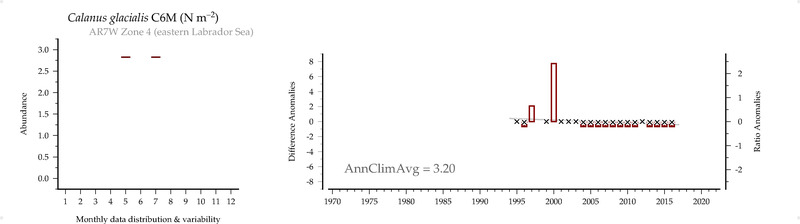
Calanus glacialis C6M (#/m2)
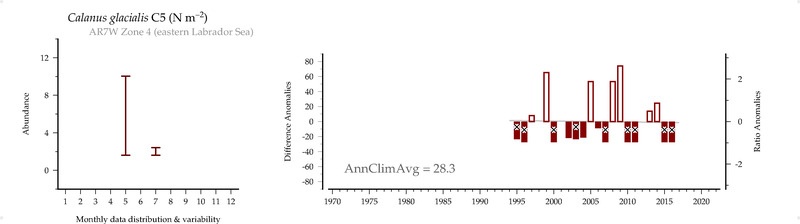
Calanus glacialis C5 (#/m2)
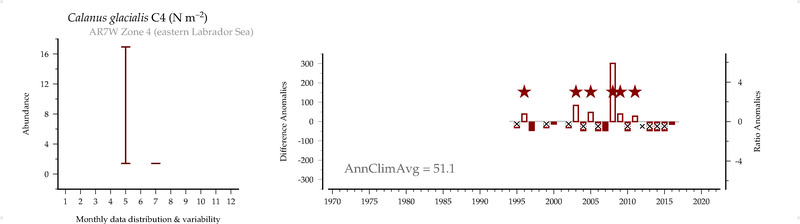
Calanus glacialis C4 (#/m2)
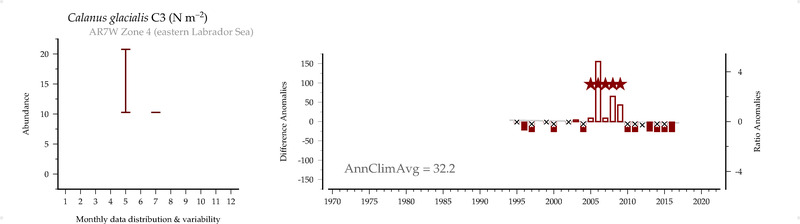
Calanus glacialis C3 (#/m2)
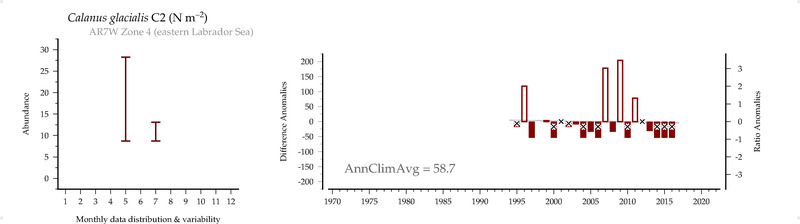
Calanus glacialis C2 (#/m2)
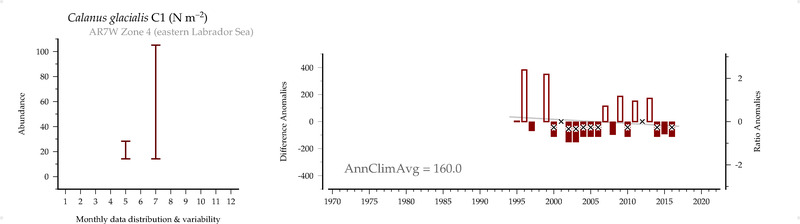
Calanus glacialis C1 (#/m2)
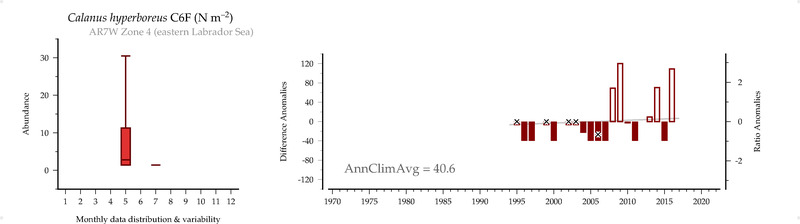
Calanus hyperboreus C6F (#/m2)
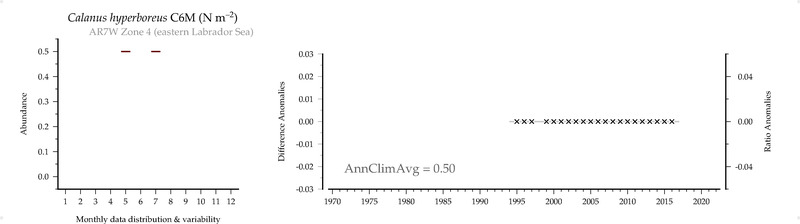
Calanus hyperboreus C6M (#/m2)
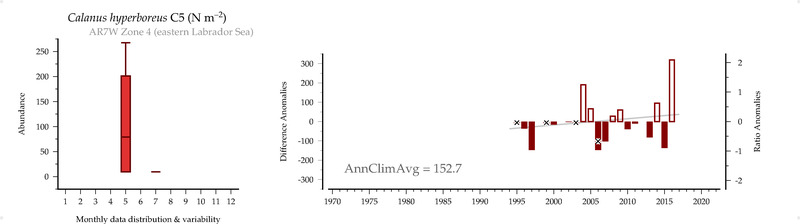
Calanus hyperboreus C5 (#/m2)
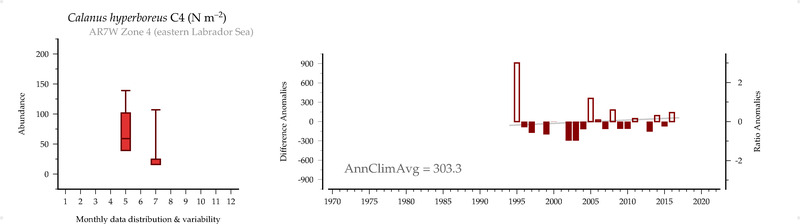
Calanus hyperboreus C4 (#/m2)
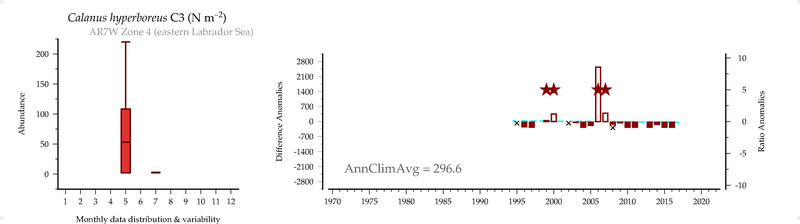
Calanus hyperboreus C3 (#/m2)
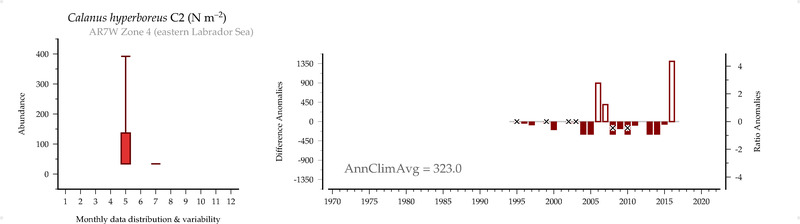
Calanus hyperboreus C2 (#/m2)
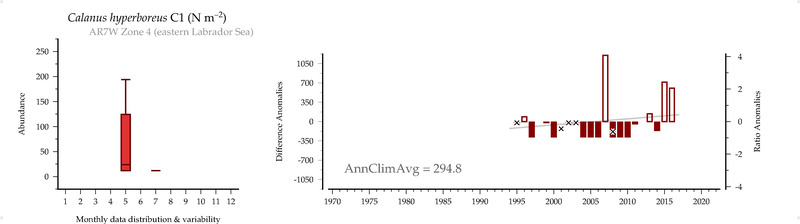
Calanus hyperboreus C1 (#/m2)
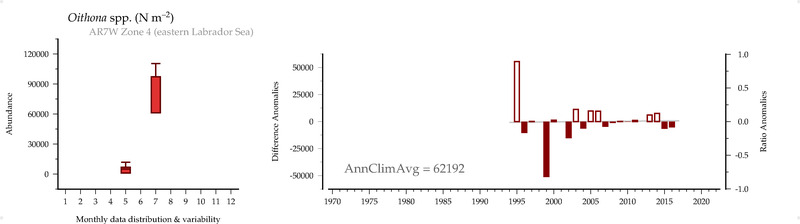
Oithona spp. (#/m2)
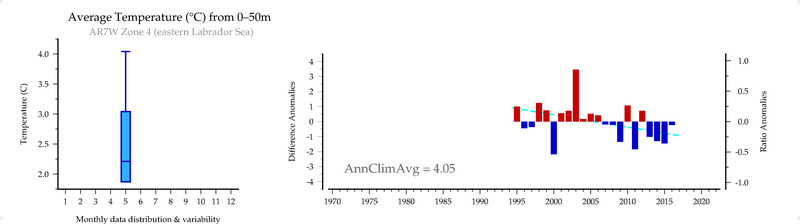
Average Temperature (C) from 0-50m
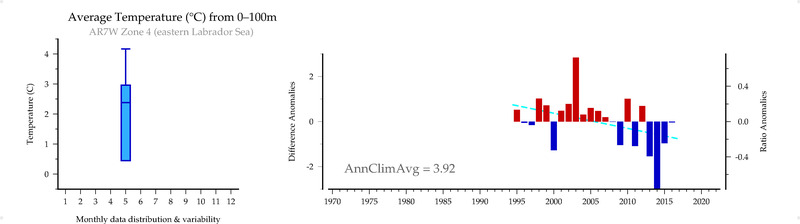
Average Temperature (C) from 0-100m
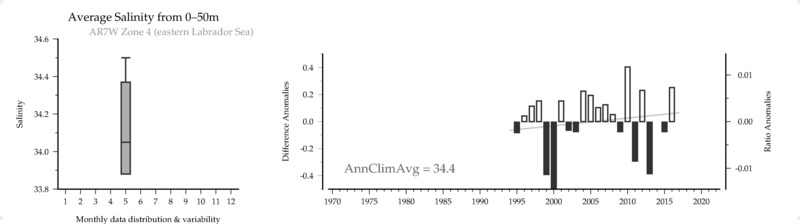
Average Salinity () from 0-50m
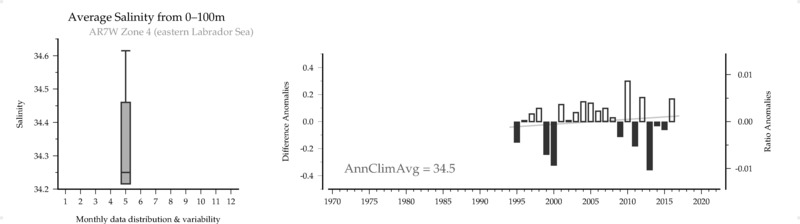
Average Salinity () from 0-100m
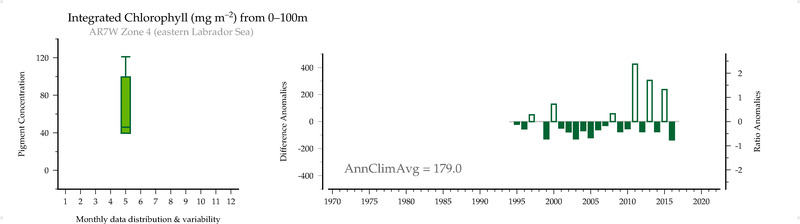
Integrated Chlorophyll (mg/m2) from 0-100m
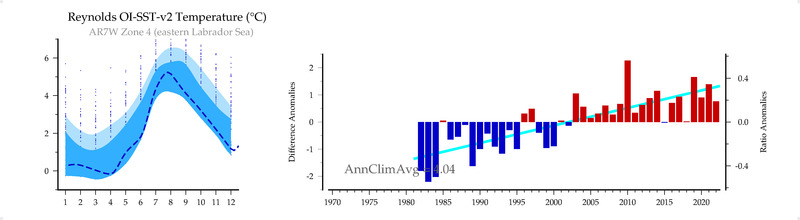
Reynolds OI-SST-v2 Temperature (C)
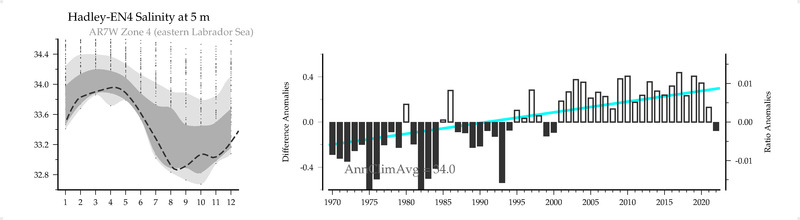
Hadley-EN4 Salinity () at 5 m
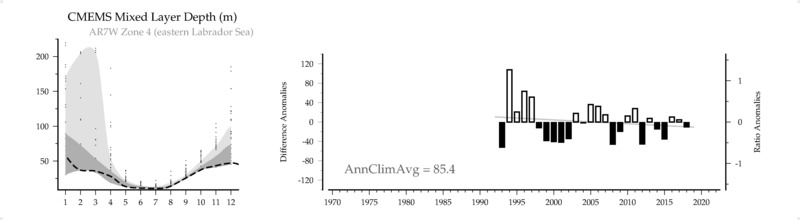
CMEMS Mixed Layer Depth (m)
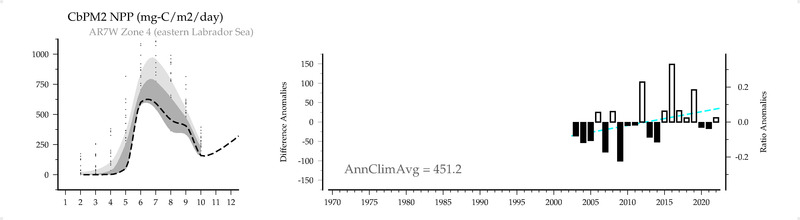
CbPM2 NPP (mg-C/m2/day)
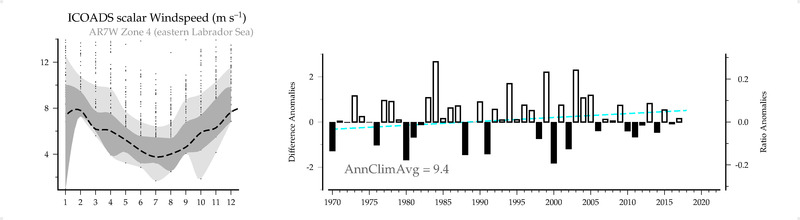
ICOADS scalar Windspeed (m/s)
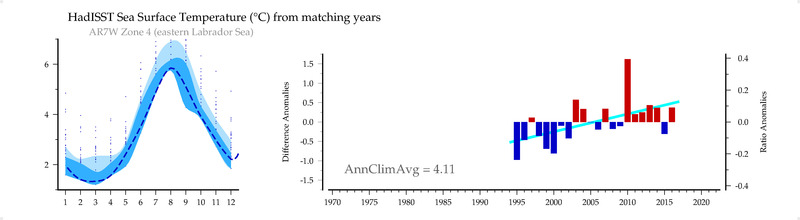
HadISST Sea Surface Temperature (C) from matching years
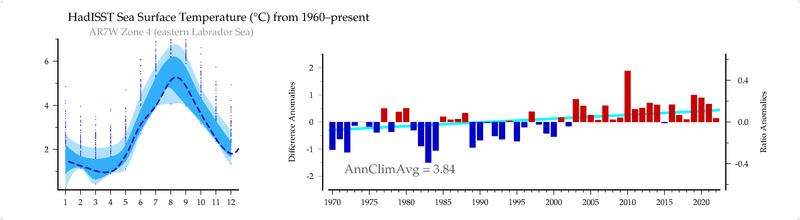
HadISST Sea Surface Temperature (C) from 1960-present
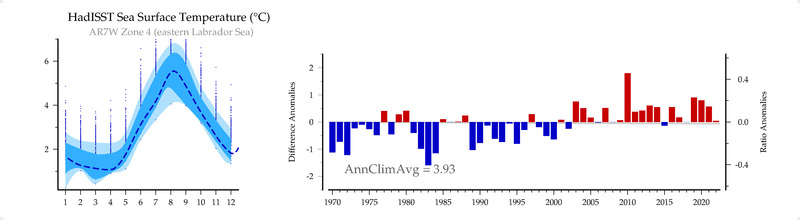
HadISST Sea Surface Temperature (C)