Multi-Variable Comparison & Correlation Plot (MVCCP)
Checked variables will have their figure shown below. Uncheck any variable to remove its plot from below.
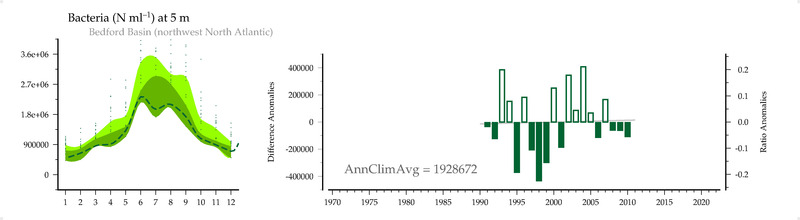
Bacteria (cells/ml) at 5 m
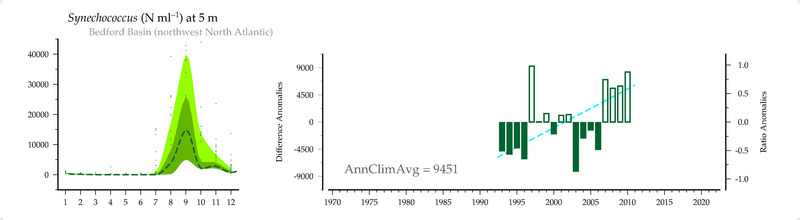
Synechococcus (cells/ml) at 5 m
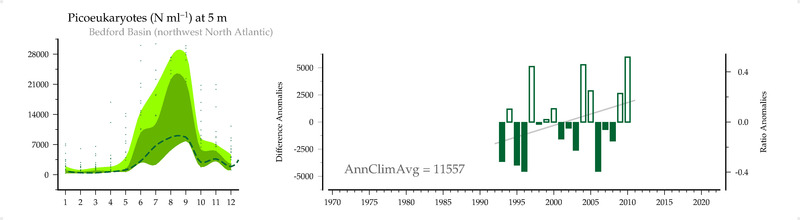
Picoeukaryotes (cells/ml) at 5 m
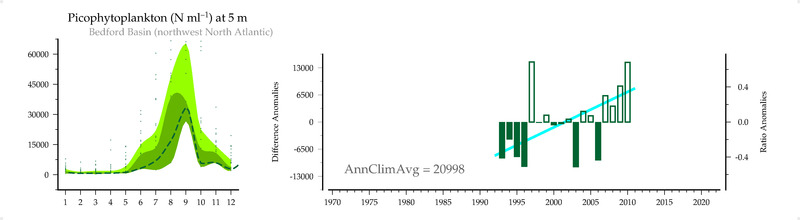
Picophytoplankton (cells/ml) at 5 m
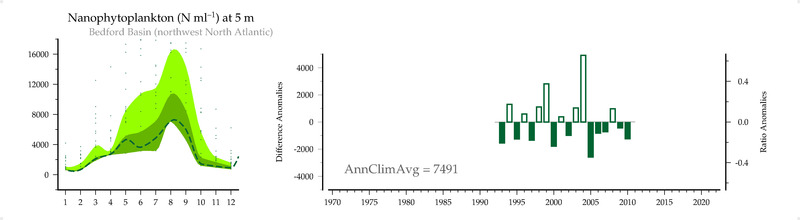
Nanophytoplankton (cells/ml) at 5 m
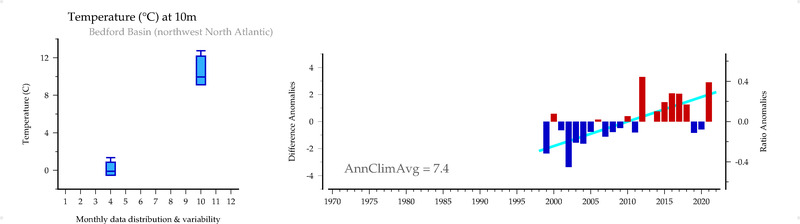
Temperature ( C ) at 10m
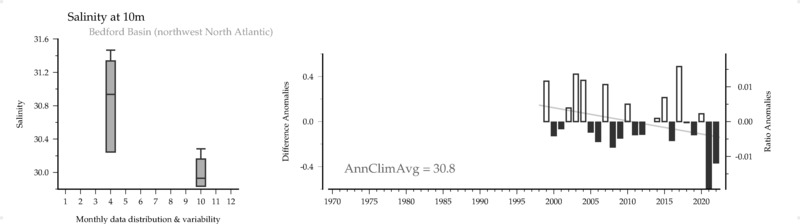
Salinity () at 10m
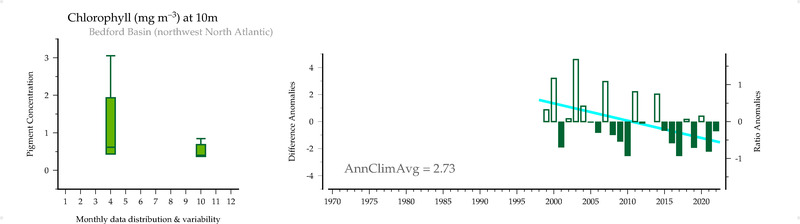
Chlorophyll (mg/m3) at 10m
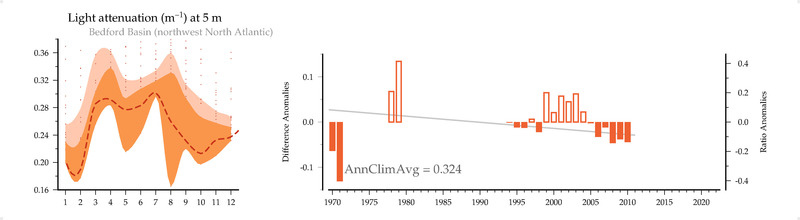
Light attenuation (m-1) at 5 m
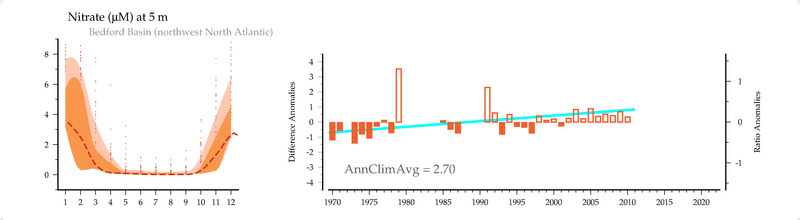
Nitrate (mmol/m3) at 5 m
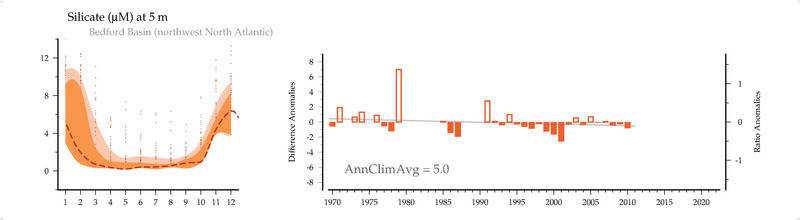
Silicate (mmol/m3) at 5 m
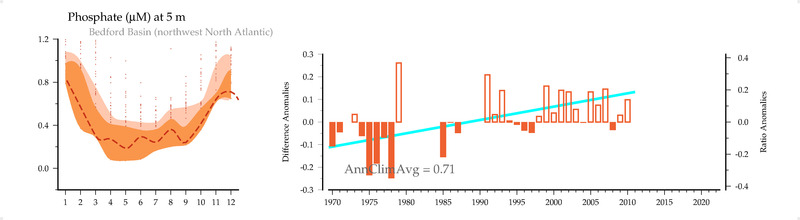
Phosphate (mmol/m3) at 5 m
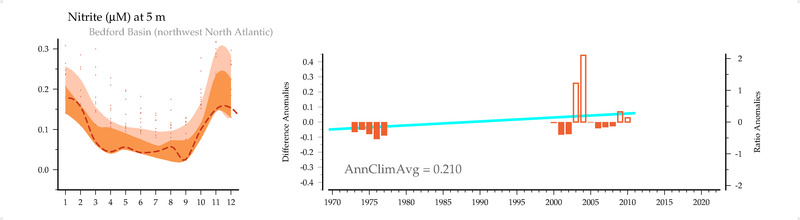
Nitrite (mmol/m3) at 5 m
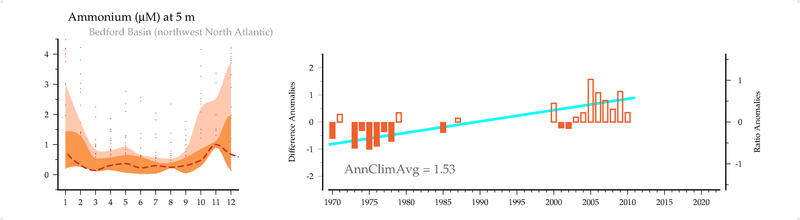
Ammonium (mmol/m3) at 5 m
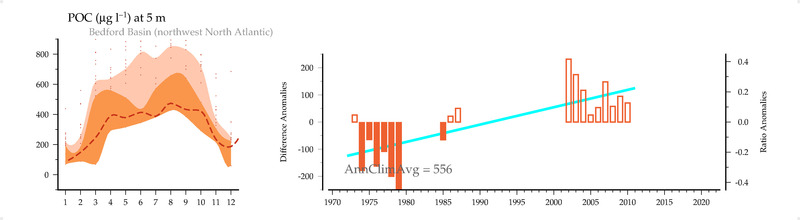
POC (ug/L) at 5 m
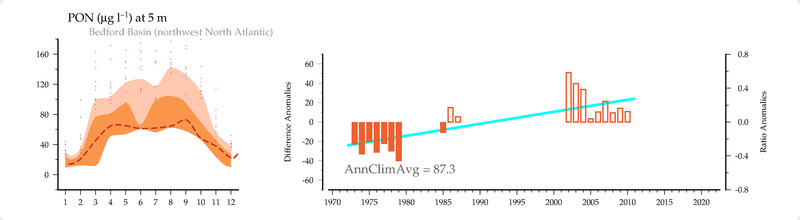
PON (ug/L) at 5 m
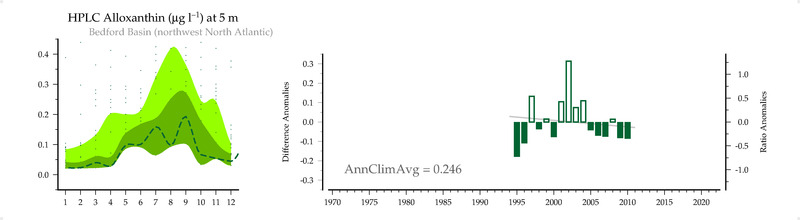
HPLC Alloxanthin (ug/L) at 5 m
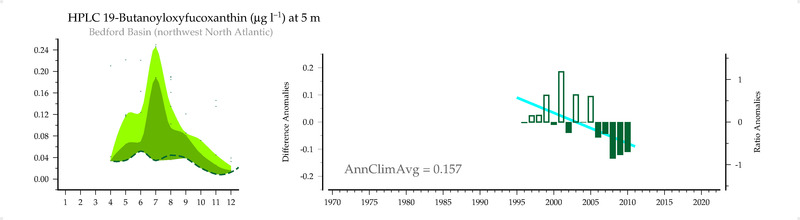
HPLC 19-Butanoyloxyfucoxanthin (ug/L) at 5 m
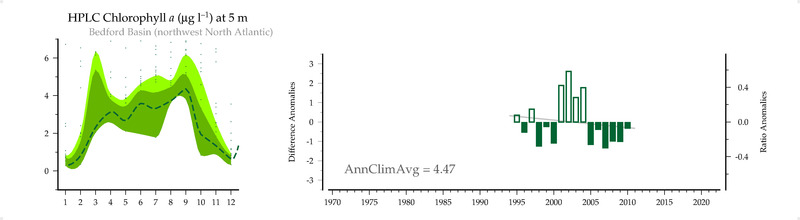
HPLC Chlorophyll a (ug/L) at 5 m
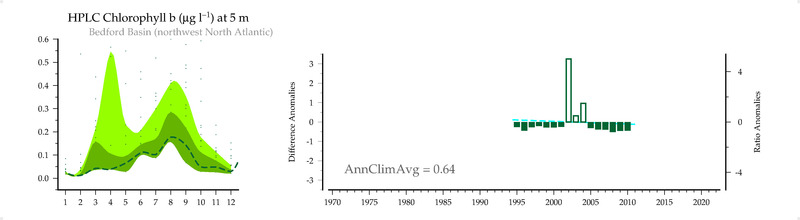
HPLC Chlorophyll b (ug/L) at 5 m
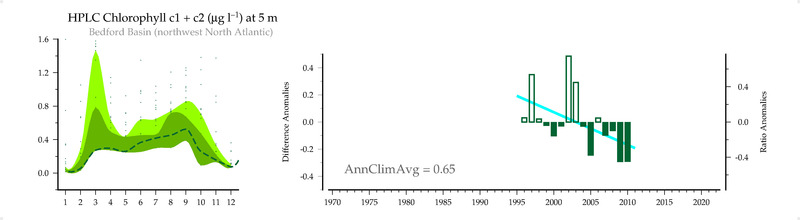
HPLC Chlorophyll c1 + c2 (ug/L) at 5 m
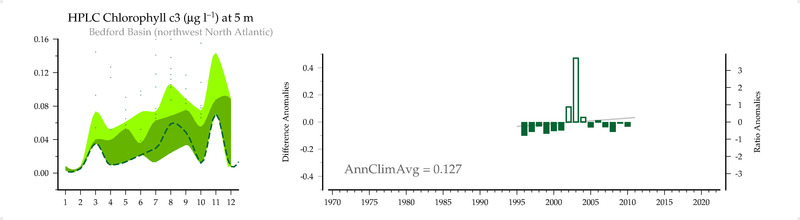
HPLC Chlorophyll c3 (ug/L) at 5 m
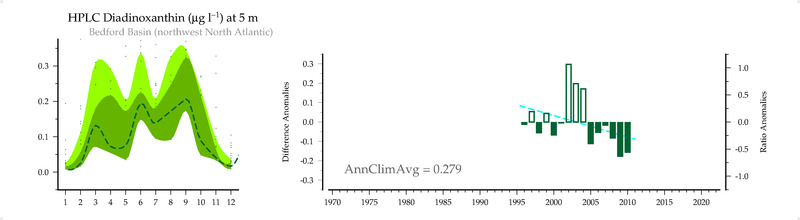
HPLC Diadinoxanthin (ug/L) at 5 m
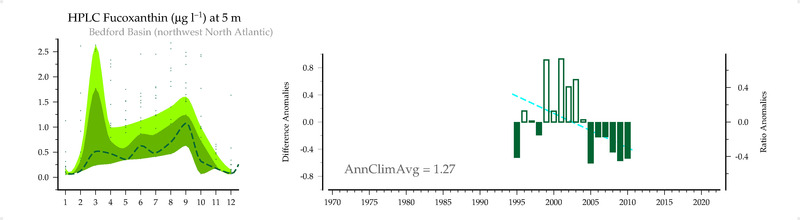
HPLC Fucoxanthin (ug/L) at 5 m
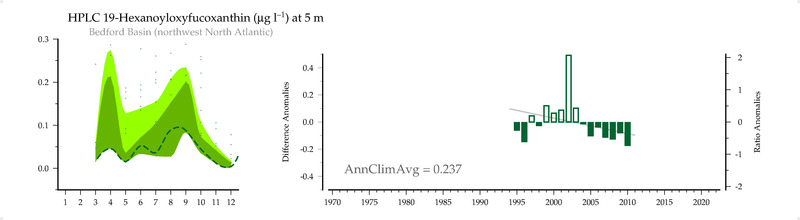
HPLC 19-Hexanoyloxyfucoxanthin (ug/L) at 5 m
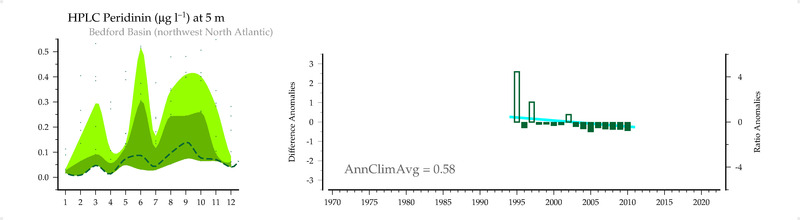
HPLC Peridinin (ug/L) at 5 m
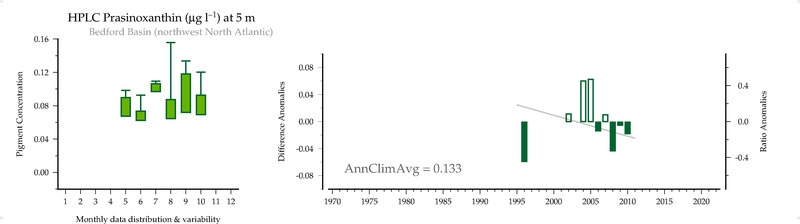
HPLC Prasinoxanthin (ug/L) at 5 m
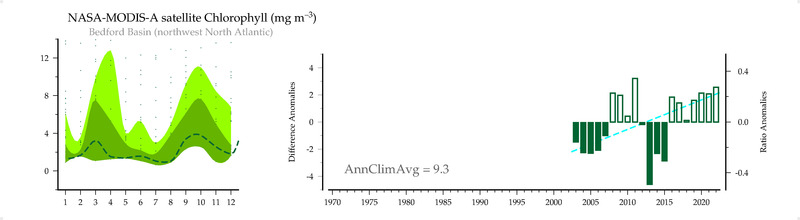
NASA-MODIS-A satellite Chlorophyll (mg/m3)
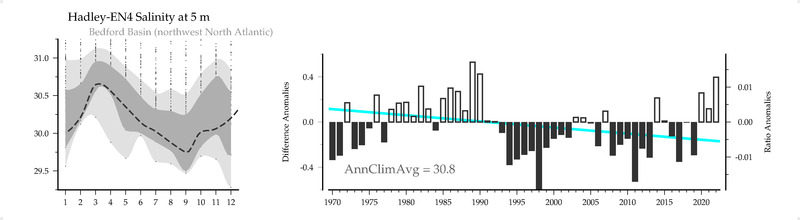
Hadley-EN4 Salinity () at 5 m
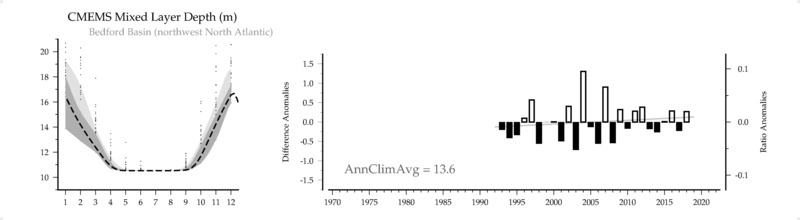
CMEMS Mixed Layer Depth (m)
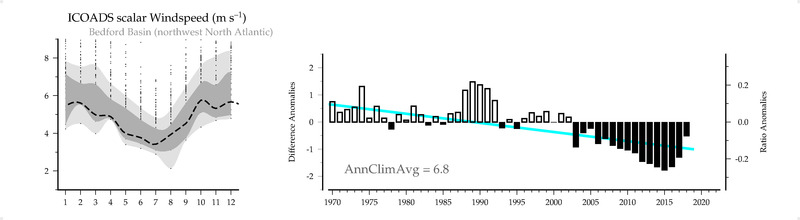
ICOADS scalar Windspeed (m/s)
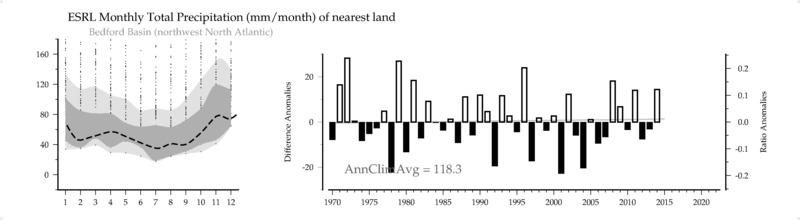
ESRL Monthly Total Precipitation (mm/month) of nearest land
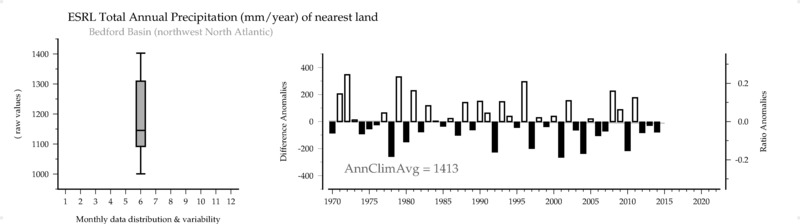
ESRL Total Annual Precipitation (mm/year) of nearest land
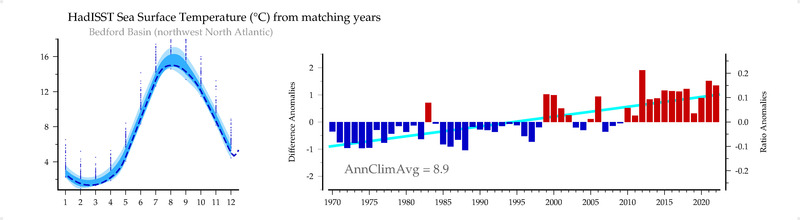
HadISST Sea Surface Temperature (C) from matching years
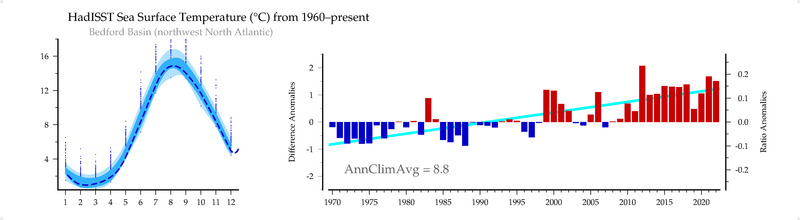
HadISST Sea Surface Temperature (C) from 1960-present
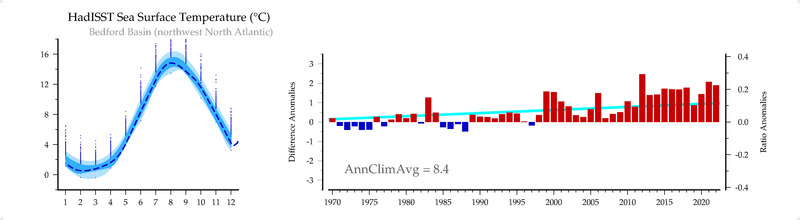
HadISST Sea Surface Temperature (C)