Multi-Variable Comparison & Correlation Plot (MVCCP)
Checked variables will have their figure shown below. Uncheck any variable to remove its plot from below.
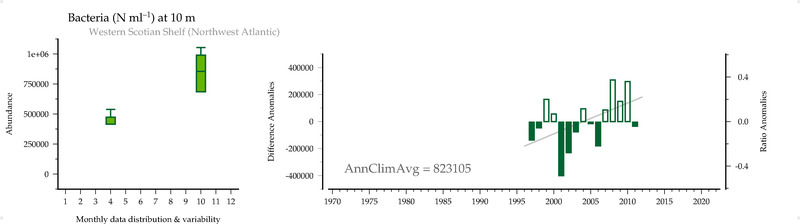
Bacteria (#/ml) at 10 m
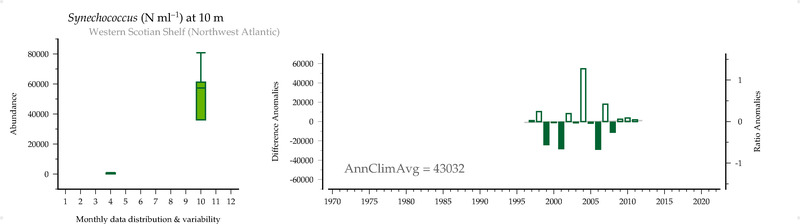
Synechococcus (#/ml) at 10 m
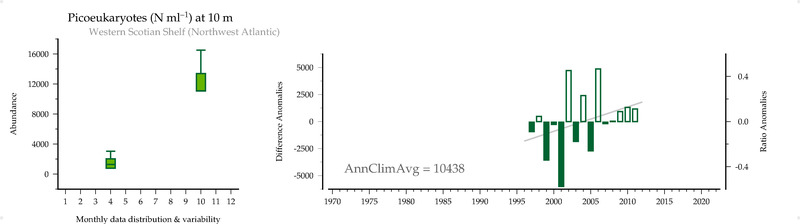
Picoeukaryotes (#/ml) at 10 m
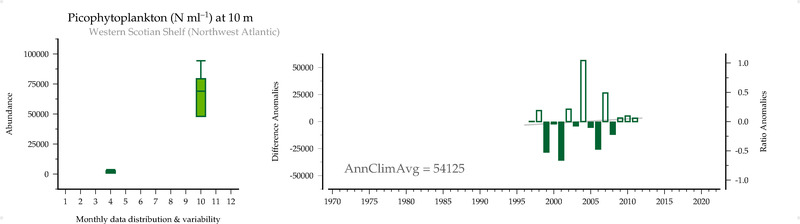
Picophytoplankton (#/ml) at 10 m
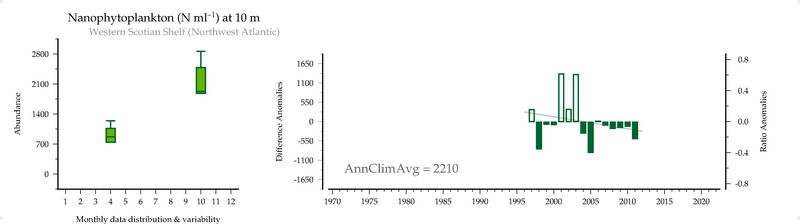
Nanophytoplankton (#/ml) at 10 m
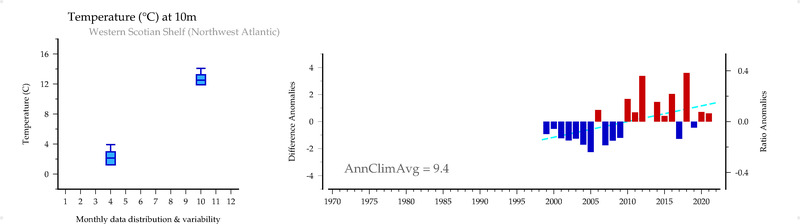
Temperature ( C ) at 10m
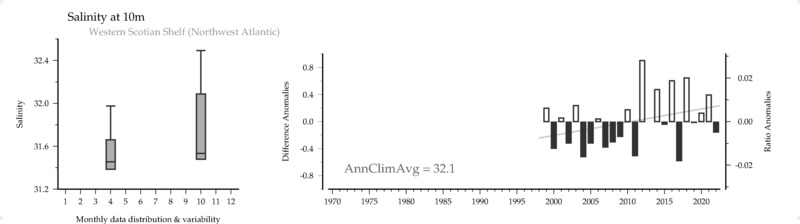
Salinity () at 10m
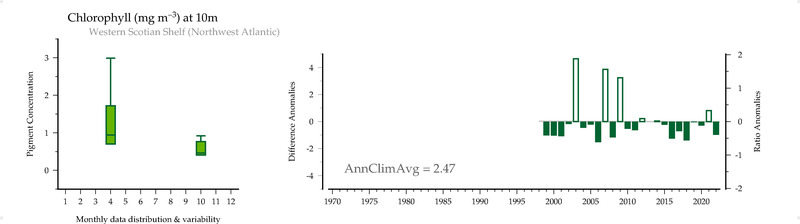
Chlorophyll (mg/m3) at 10m
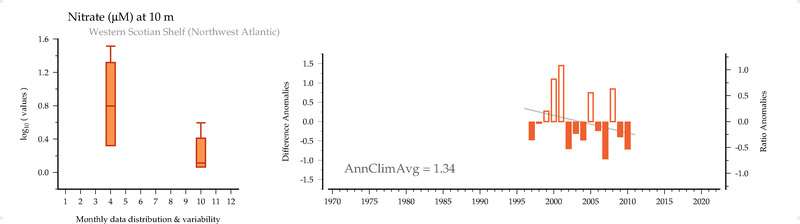
Nitrate (uM) at 10 m
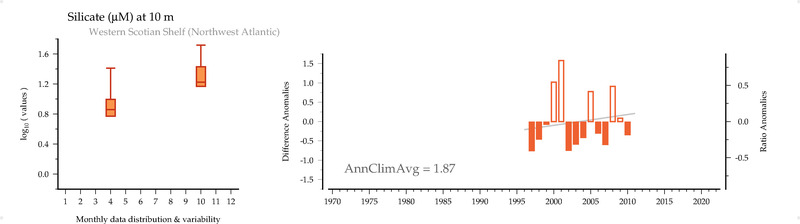
Silicate (uM) at 10 m
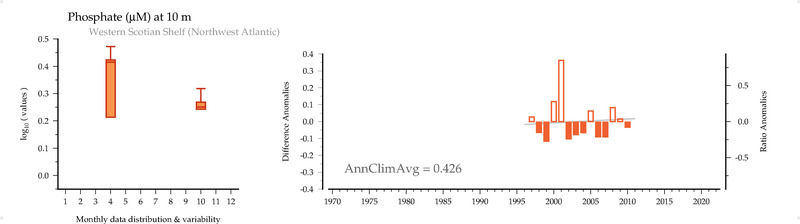
Phosphate (uM) at 10 m
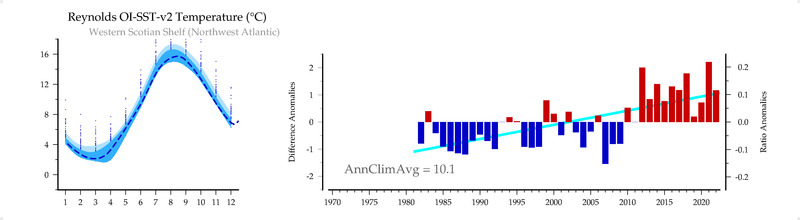
Reynolds OI-SST-v2 Temperature (C)
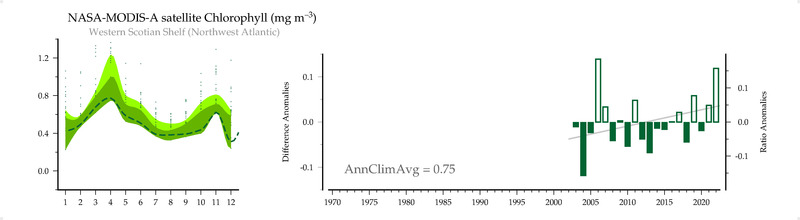
NASA-MODIS-A satellite Chlorophyll (mg/m3)
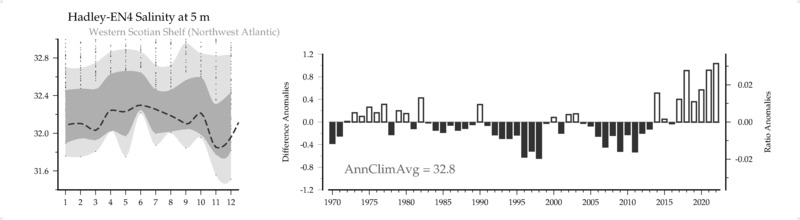
Hadley-EN4 Salinity () at 5 m
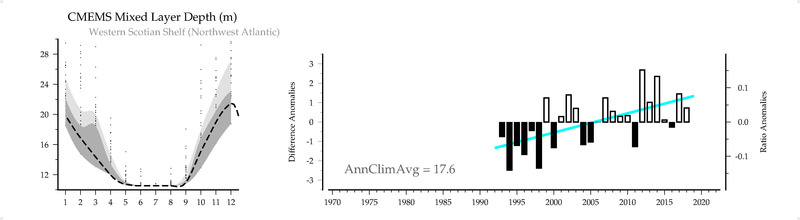
CMEMS Mixed Layer Depth (m)
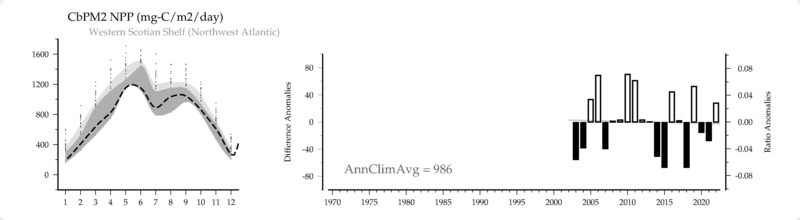
CbPM2 NPP (mg-C/m2/day)
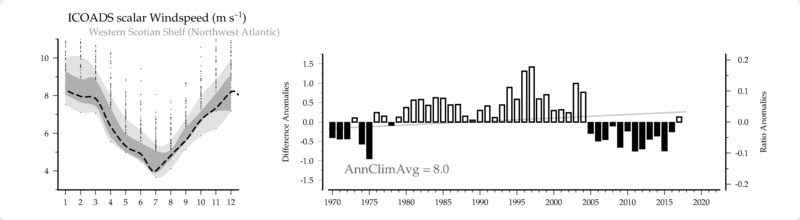
ICOADS scalar Windspeed (m/s)
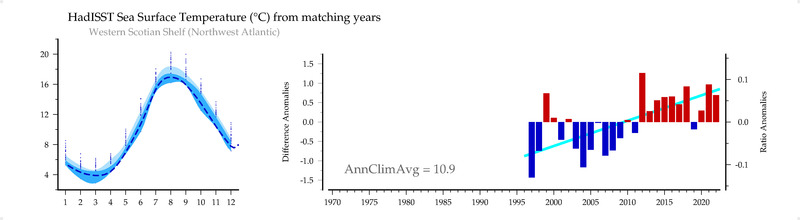
HadISST Sea Surface Temperature (C) from matching years
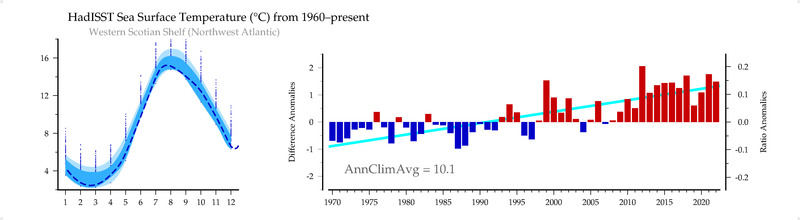
HadISST Sea Surface Temperature (C) from 1960-present
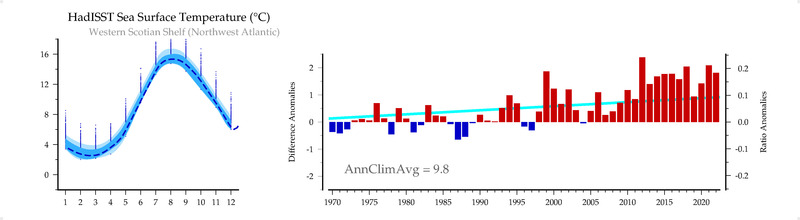
HadISST Sea Surface Temperature (C)