Multi-Variable Comparison & Correlation Plot (MVCCP)
Checked variables will have their figure shown below. Uncheck any variable to remove its plot from below.
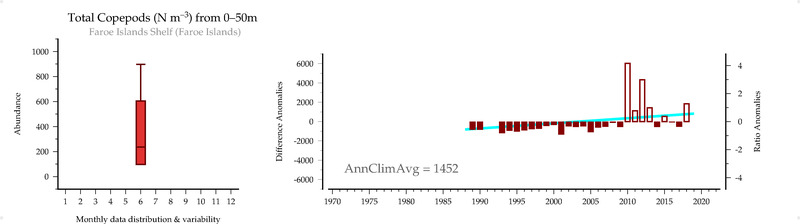
Total Copepods (#/m3) from 0-50m
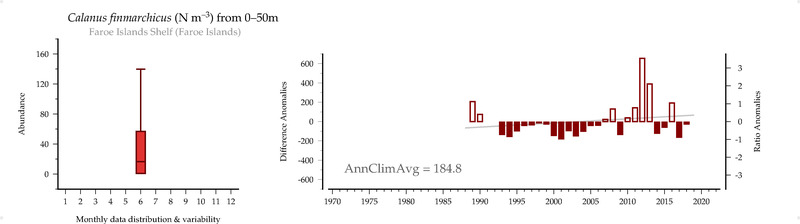
Calanus finmarchicus (#/m3) from 0-50m
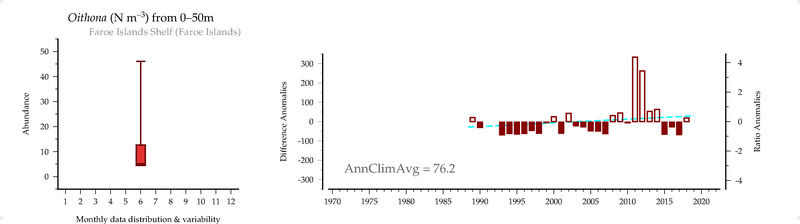
Oithona (#/m3) from 0-50m
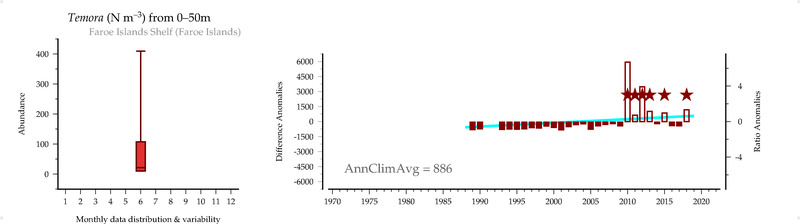
Temora (#/m3) from 0-50m
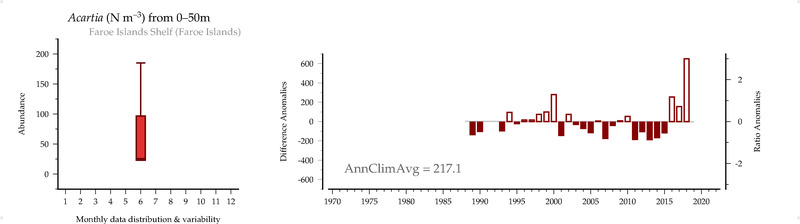
Acartia (#/m3) from 0-50m
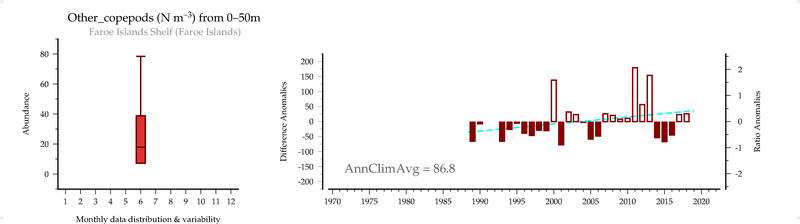
Other_copepods (#/m3) from 0-50m
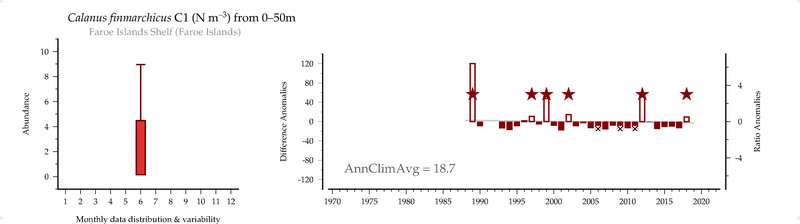
Calanus finmarchicus C1 (#/m3) from 0-50m
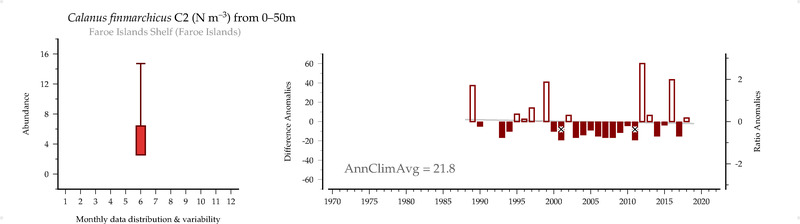
Calanus finmarchicus C2 (#/m3) from 0-50m
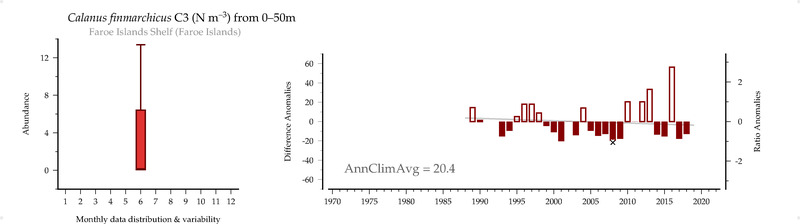
Calanus finmarchicus C3 (#/m3) from 0-50m
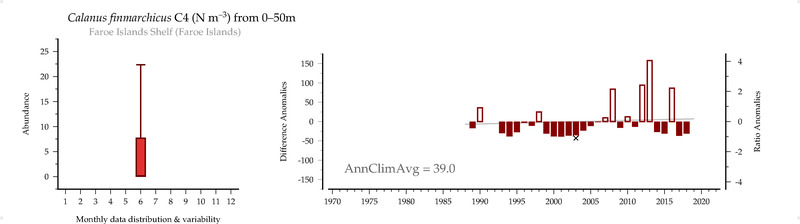
Calanus finmarchicus C4 (#/m3) from 0-50m
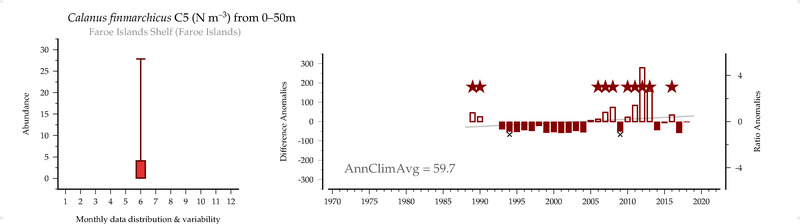
Calanus finmarchicus C5 (#/m3) from 0-50m
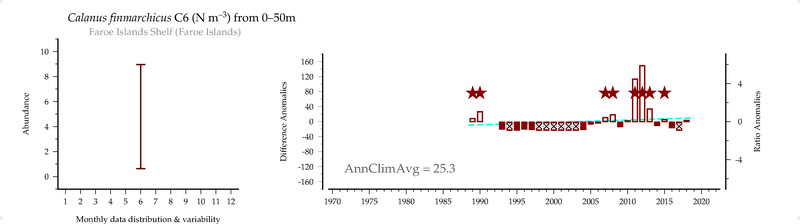
Calanus finmarchicus C6 (#/m3) from 0-50m
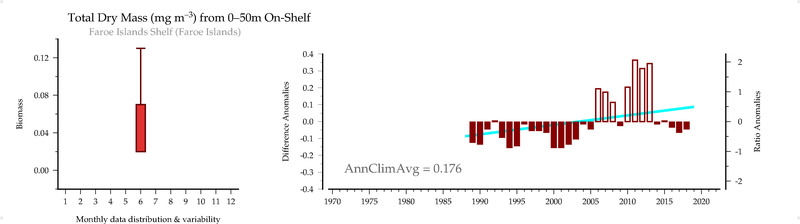
Total Dry Mass (mg/m3) from 0-50m On-Shelf
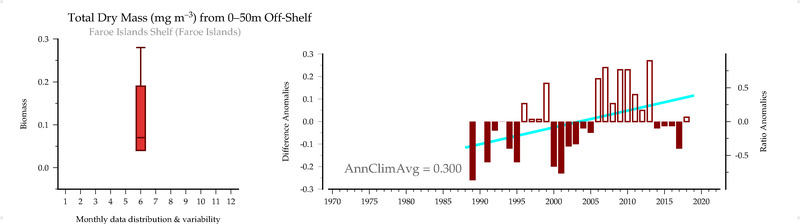
Total Dry Mass (mg/m3) from 0-50m Off-Shelf
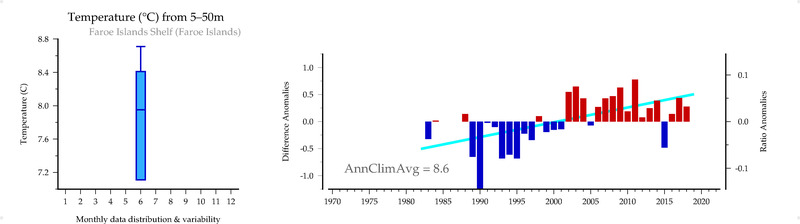
Temperature (C) from 5-50m
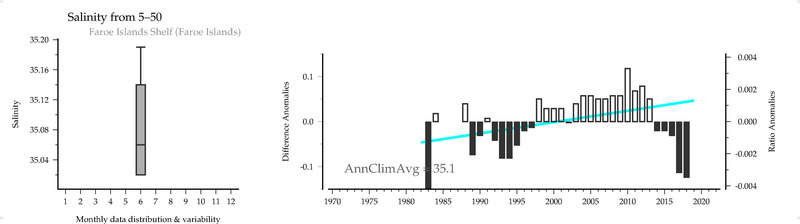
Salinity () from 5-50
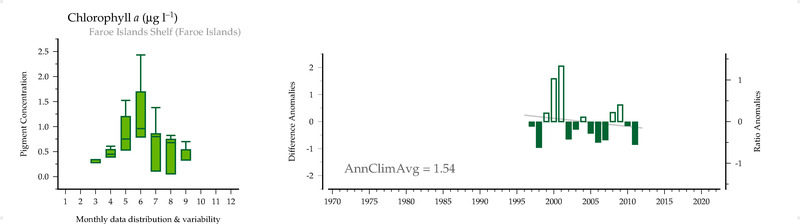
Chlorophyll-a (ug/L)
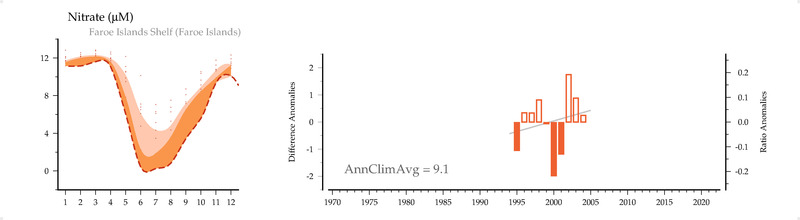
Nitrate (uM)
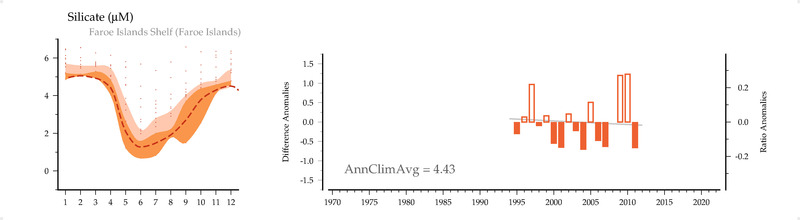
Silicate (uM)
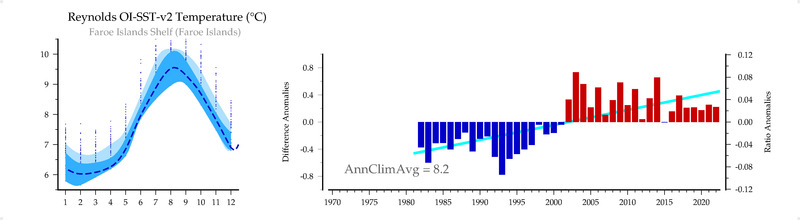
Reynolds OI-SST-v2 Temperature (C)
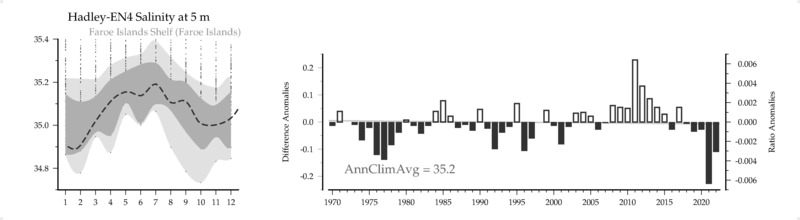
Hadley-EN4 Salinity () at 5 m
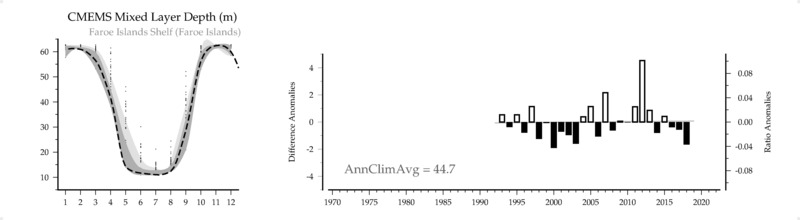
CMEMS Mixed Layer Depth (m)
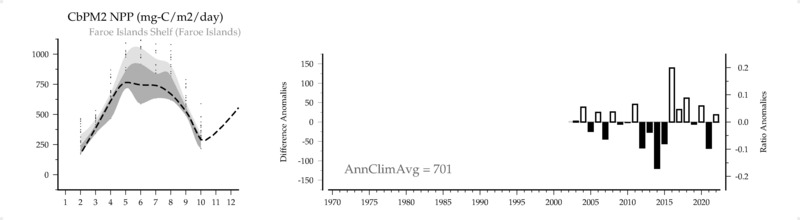
CbPM2 NPP (mg-C/m2/day)
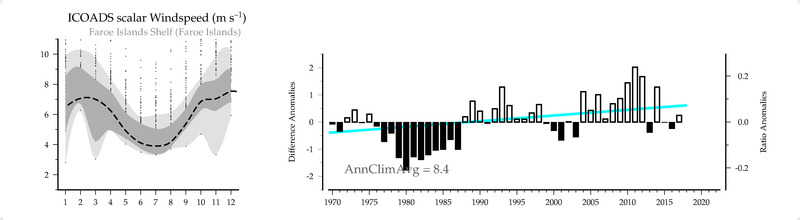
ICOADS scalar Windspeed (m/s)
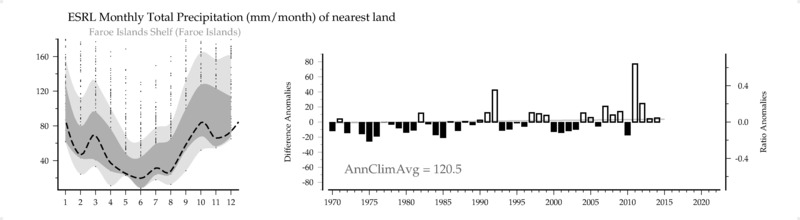
ESRL Monthly Total Precipitation (mm/month) of nearest land
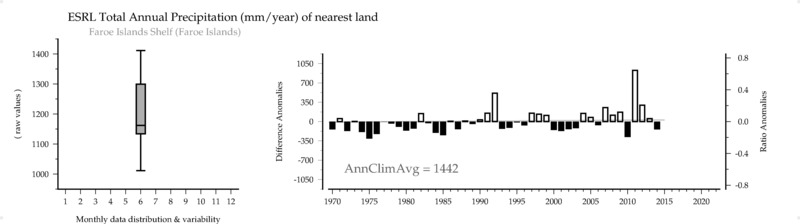
ESRL Total Annual Precipitation (mm/year) of nearest land
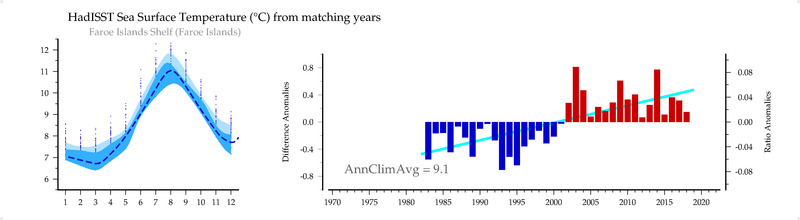
HadISST Sea Surface Temperature (C) from matching years
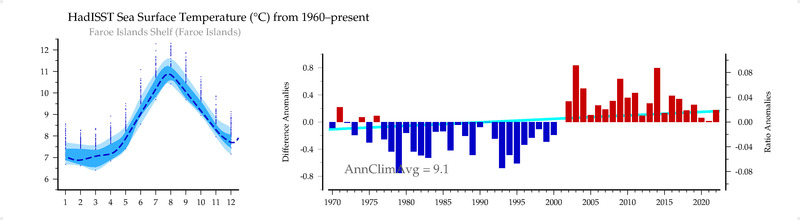
HadISST Sea Surface Temperature (C) from 1960-present
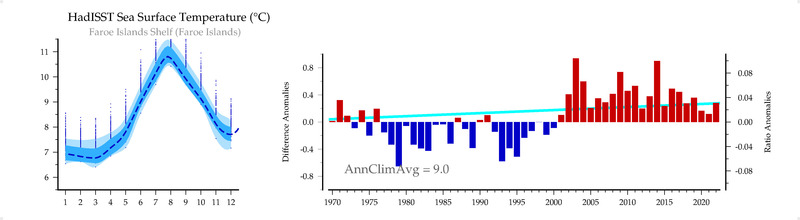
HadISST Sea Surface Temperature (C)