Multi-Variable Comparison & Correlation Plot (MVCCP)
Checked variables will have their figure shown below. Uncheck any variable to remove its plot from below.
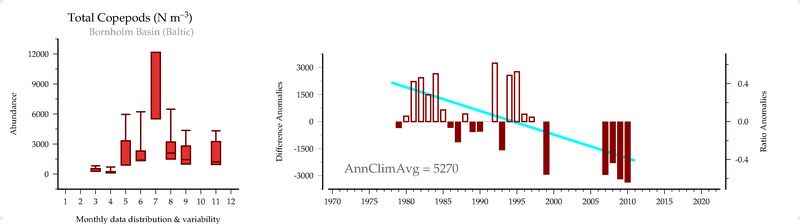
Total Copepods (#/m3)
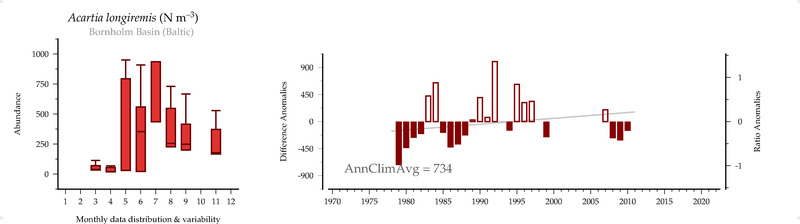
Acartia longiremis (#/m3)
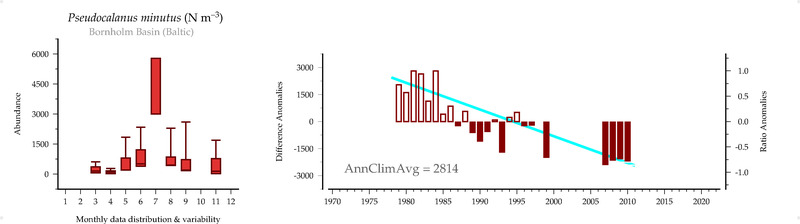
Pseudocalanus minutus (#/m3)
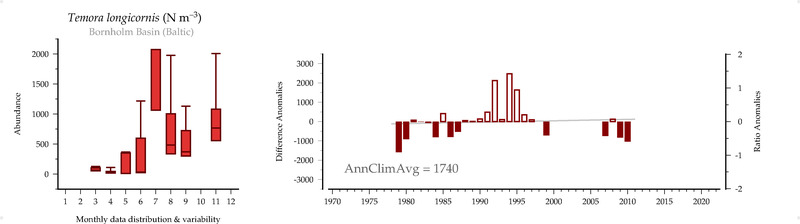
Temora longicornis (#/m3)
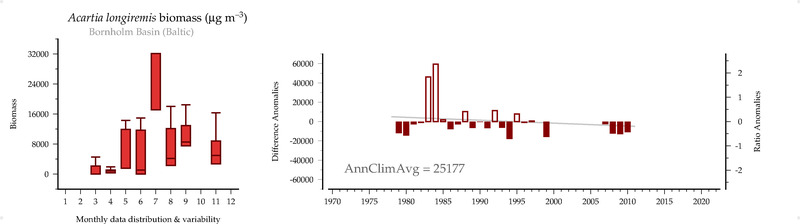
Acartia longiremis biomass (ug/m3)
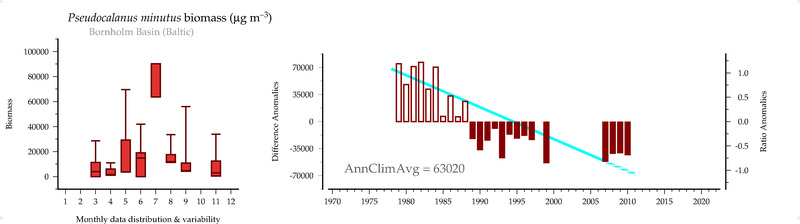
Pseudocalanus minutus biomass (ug/m3)
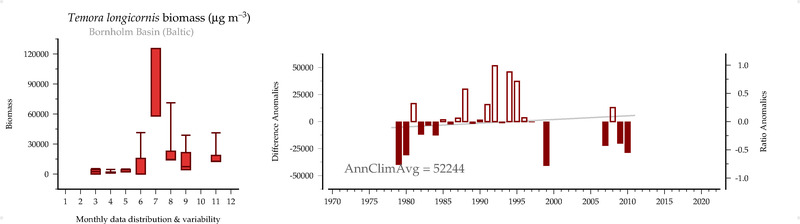
Temora longicornis biomass (ug/m3)
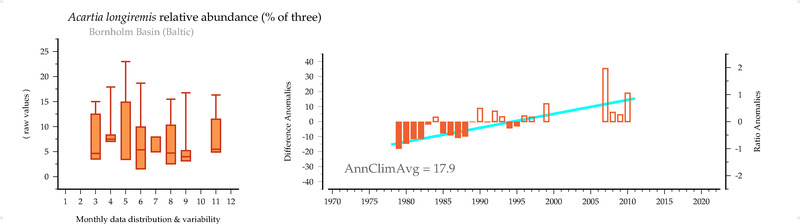
Acartia longiremis relative abundance (% of three)
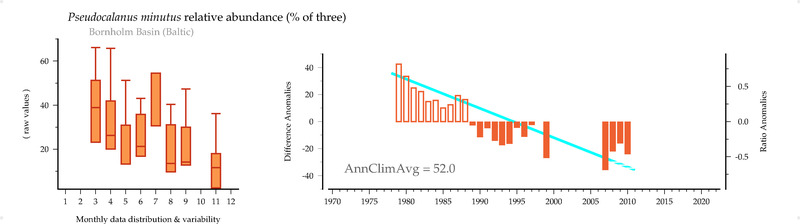
Pseudocalanus minutus relative abundance (% of three)
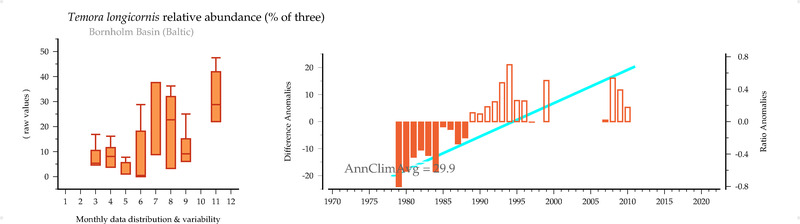
Temora longicornis relative abundance (% of three)
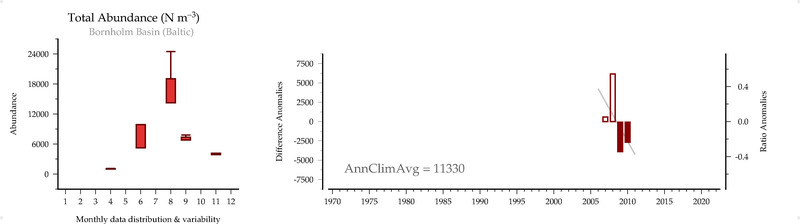
Total Abundance (#/m3)
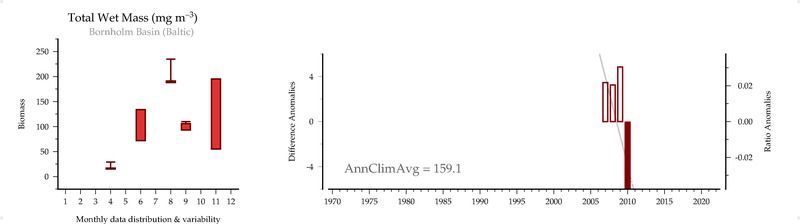
Total Wet Mass (mg/m3)
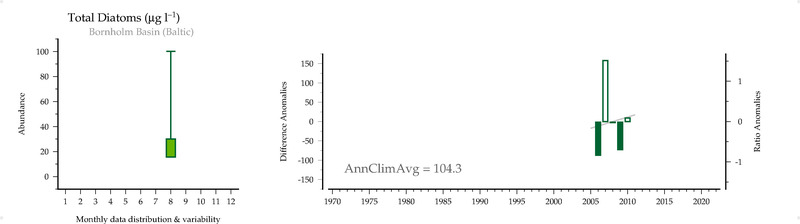
Total Diatoms (ug/l)
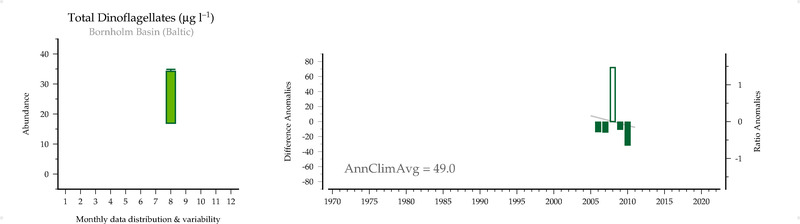
Total Dinoflagellates (ug/L)
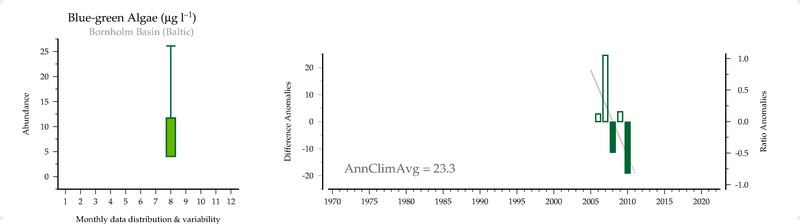
Blue-green Algae (ug/L)
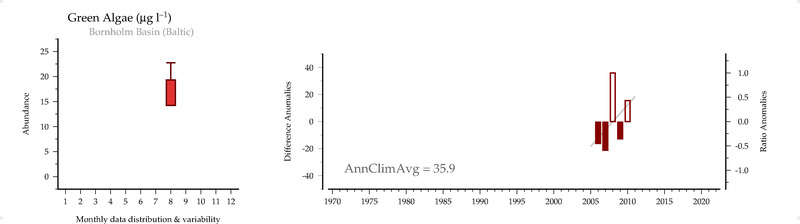
Green Algae (ug/L)
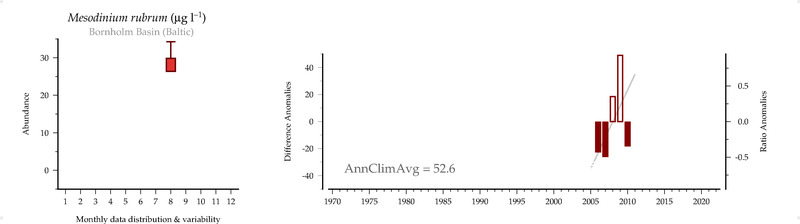
Mesodinium rubrum (ug/L)
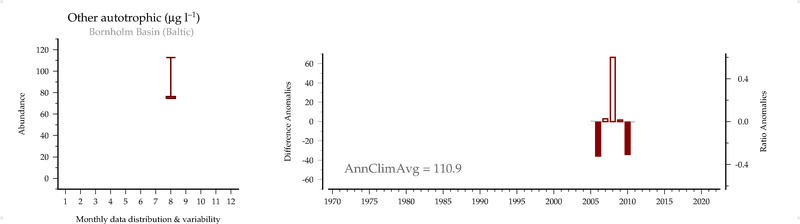
Other autotrophic (ug/L)
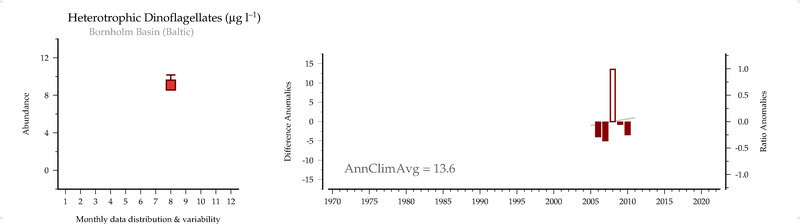
Heterotrophic Dinoflagellates (ug/L)
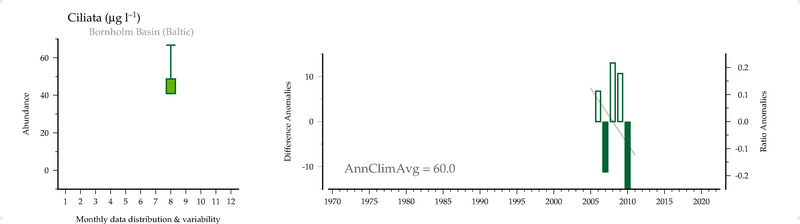
Ciliata (ug/L)
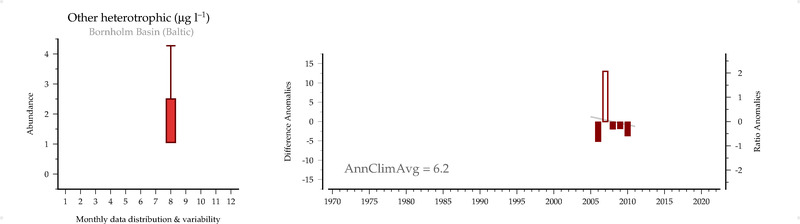
Other heterotrophic (ug/L)
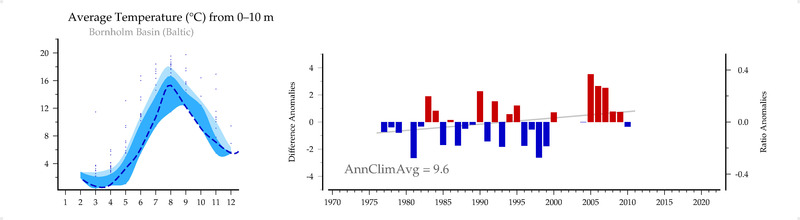
Average Temperature (C) from 0-10 m
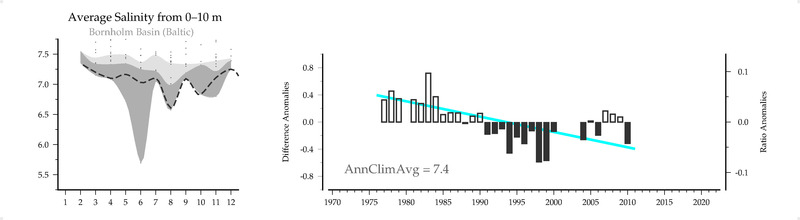
Average Salinity (pss) from 0-10 m
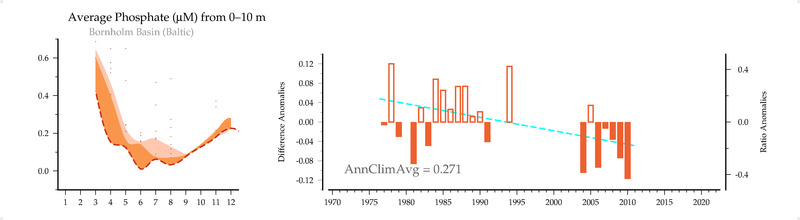
Average PO4 (uM) from 0-10 m
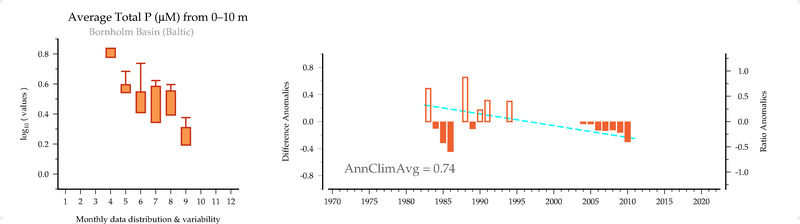
Average Total P (uM) from 0-10 m
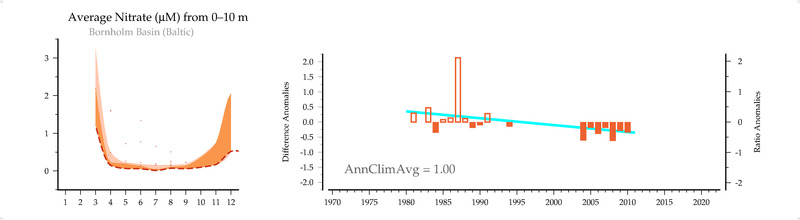
Average NO3 (uM) from 0-10 m
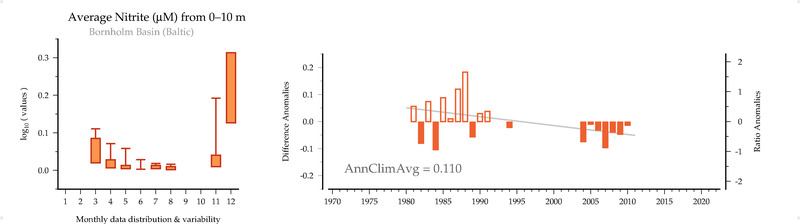
Average NO2 (uM) from 0-10 m
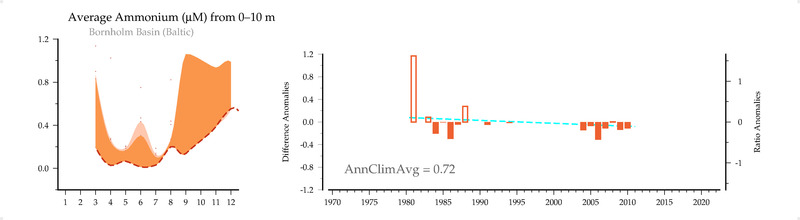
Average NH4 (uM) from 0-10 m
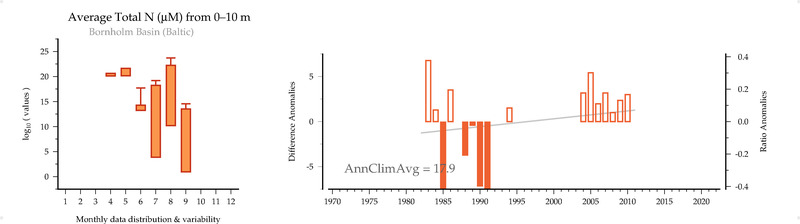
Average Total N (uM) from 0-10 m
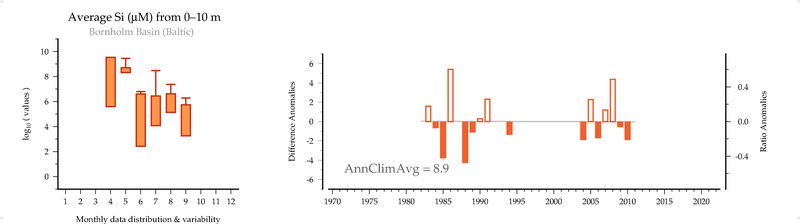
Average Si (uM) from 0-10 m
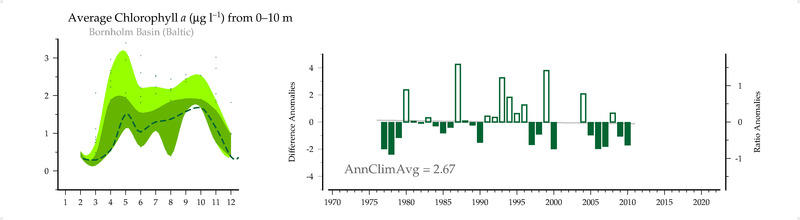
Average Chlorophyll-a (ug/L) from 0-10 m
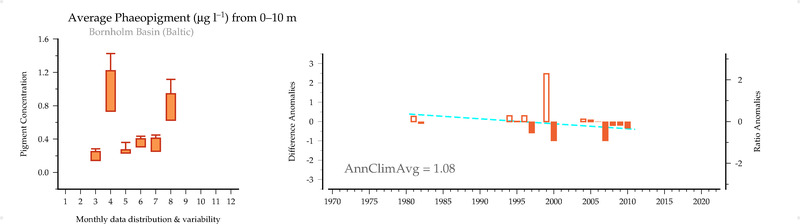
Average Phaeopigment (ug/L) from 0-10 m
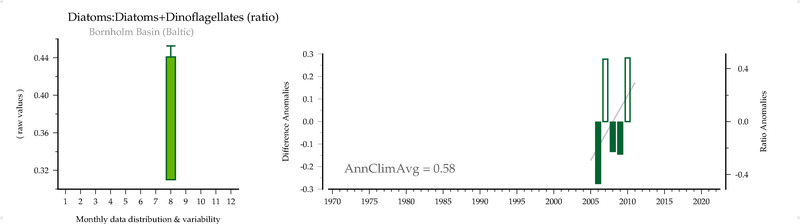
Diatoms:Diatoms+Dinoflagellates (ratio)
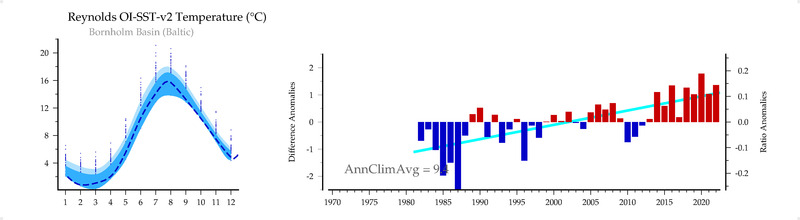
Reynolds OI-SST-v2 Temperature (C)
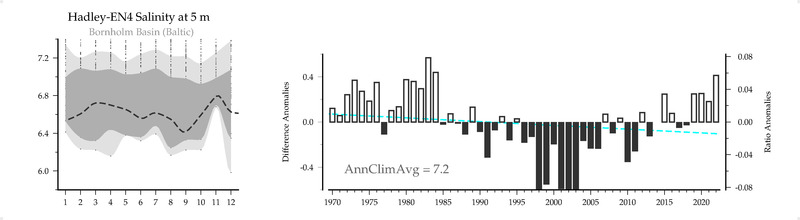
Hadley-EN4 Salinity () at 5 m
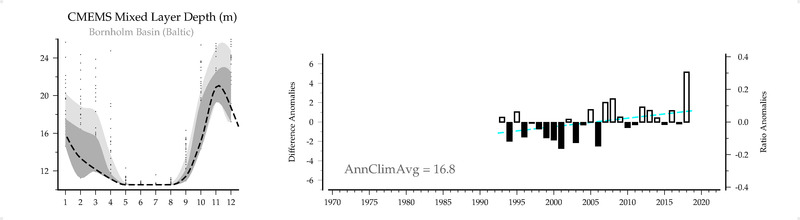
CMEMS Mixed Layer Depth (m)
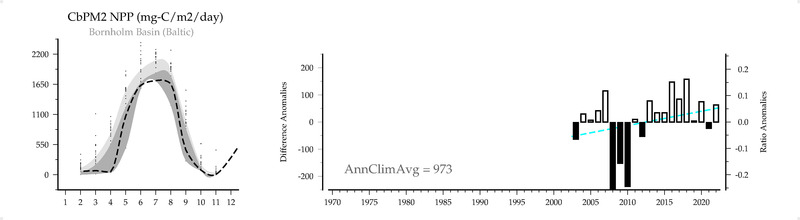
CbPM2 NPP (mg-C/m2/day)
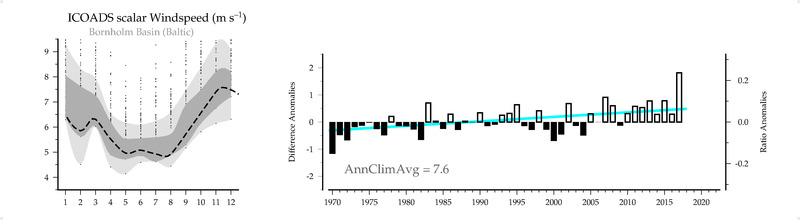
ICOADS scalar Windspeed (m/s)
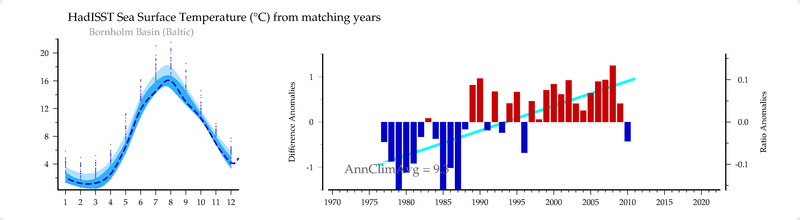
HadISST Sea Surface Temperature (C) from matching years
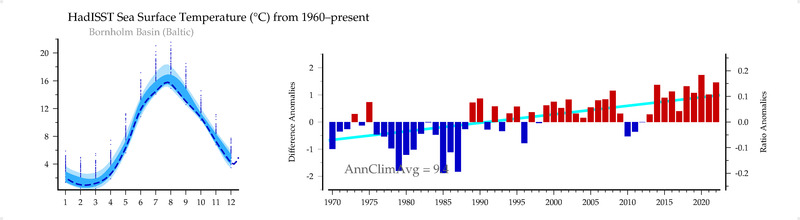
HadISST Sea Surface Temperature (C) from 1960-present
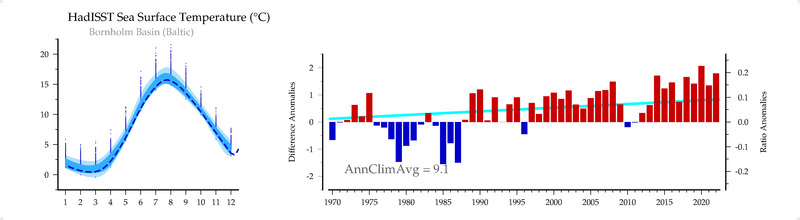
HadISST Sea Surface Temperature (C)