Multi-Variable Comparison & Correlation Plot (MVCCP)
Checked variables will have their figure shown below. Uncheck any variable to remove its plot from below.
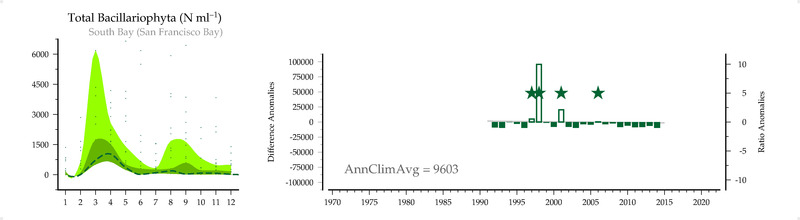
Total Bacillariophyta (#/ml)
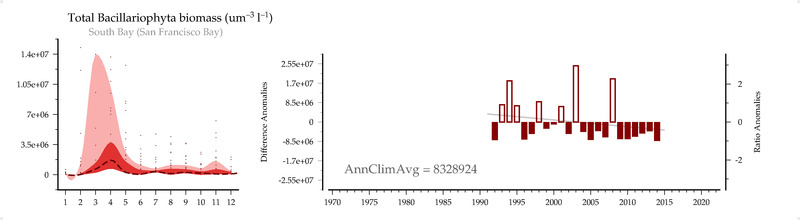
Total Bacillariophyta biomass (um3/L)
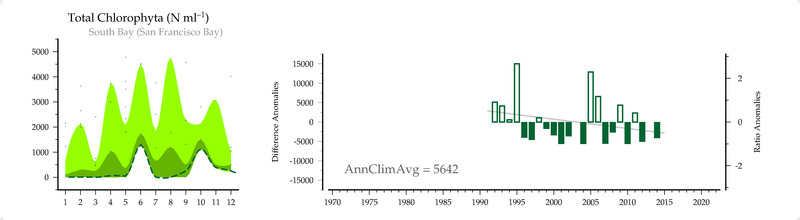
Total Chlorophyta (#/ml)
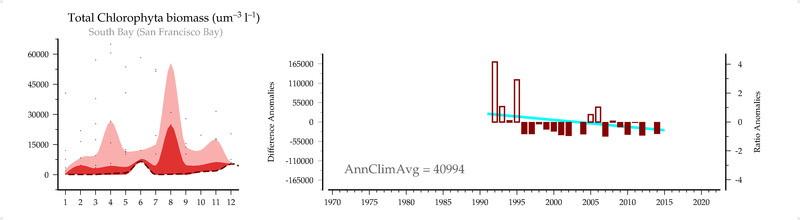
Total Chlorophyta biomass (um3/L)
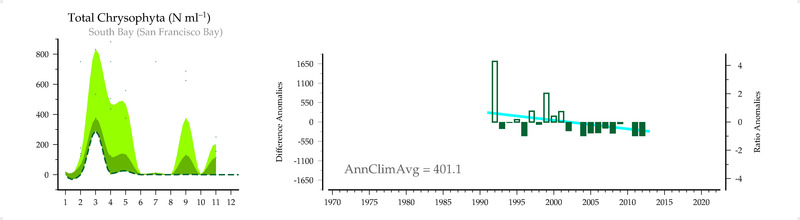
Total Chrysophyta (#/ml)
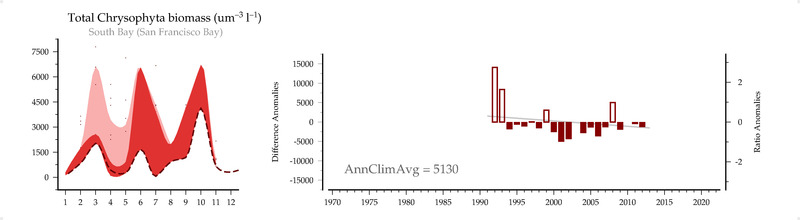
Total Chrysophyta biomass (um3/L)
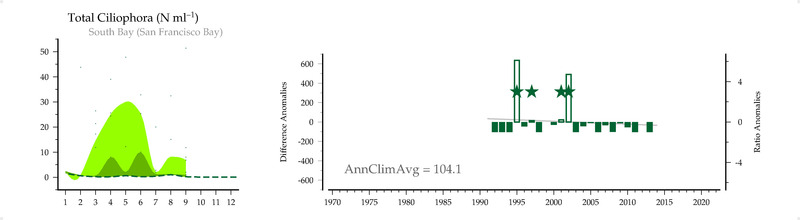
Total Ciliophora (#/ml)
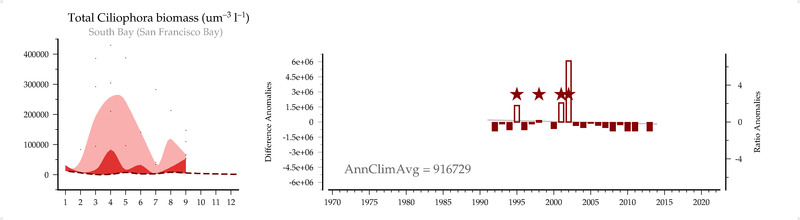
Total Ciliophora biomass (um3/L)
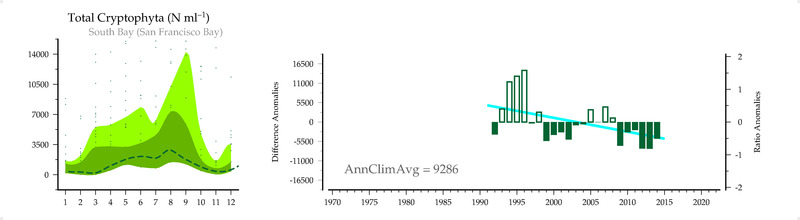
Total Cryptophyta (#/ml)
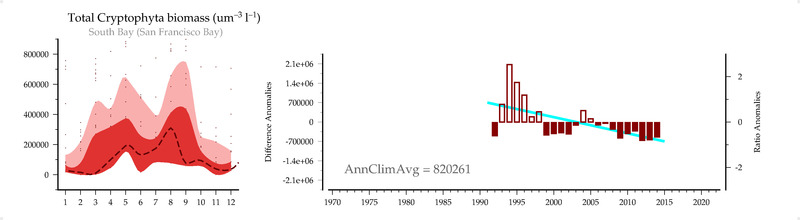
Total Cryptophyta biomass (um3/L)
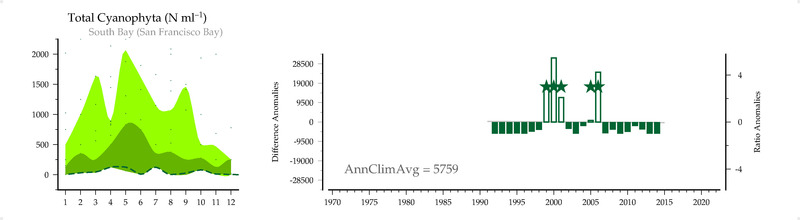
Total Cyanophyta (#/ml)
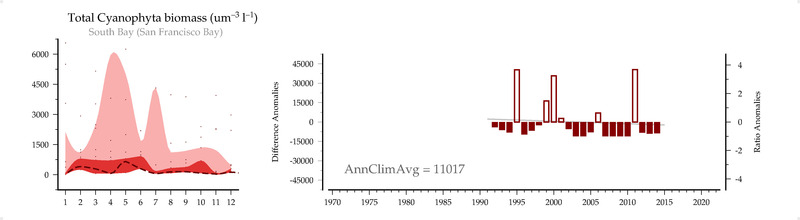
Total Cyanophyta biomass (um3/L)
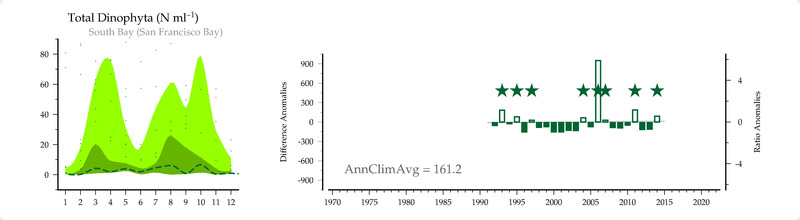
Total Dinophyta (#/ml)
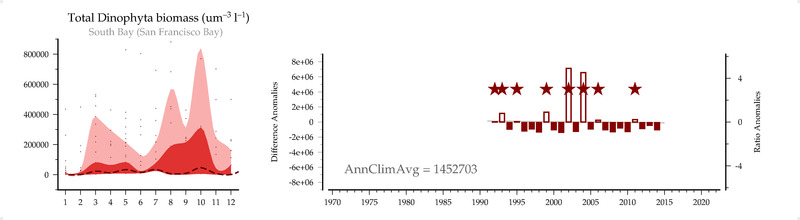
Total Dinophyta biomass (um3/L)
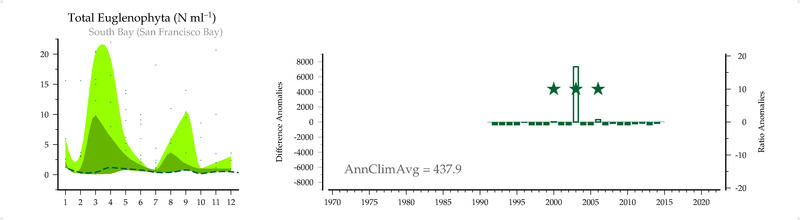
Total Euglenophyta (#/ml)
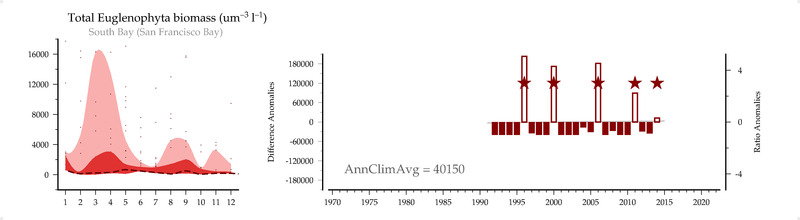
Total Euglenophyta biomass (um3/L)
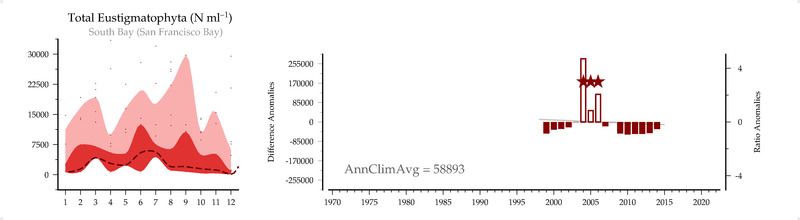
Total Eustigmatophyta (#/ml)
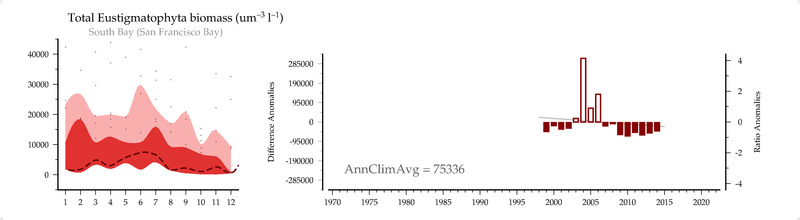
Total Eustigmatophyta biomass (um3/L)
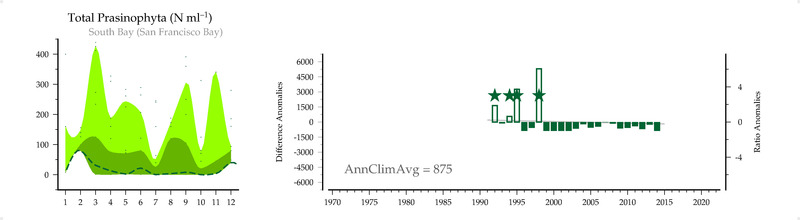
Total Prasinophyta (#/ml)
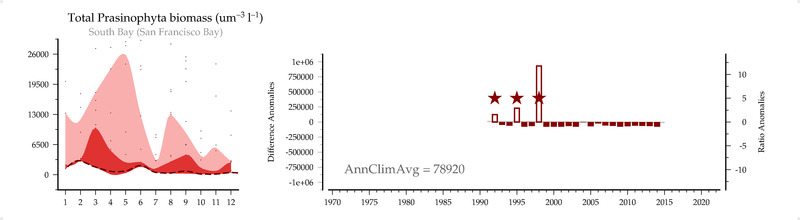
Total Prasinophyta biomass (um3/L)
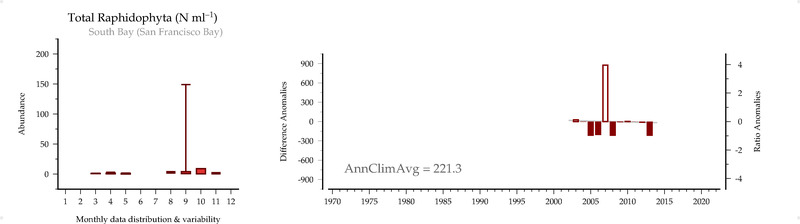
Total Raphidophyta (#/ml)
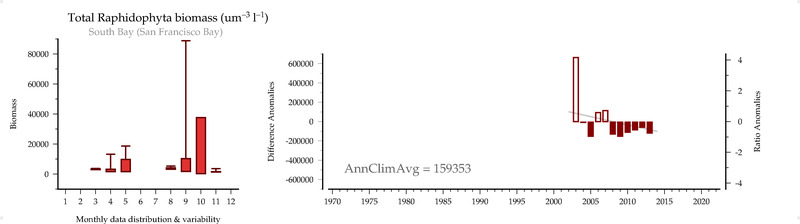
Total Raphidophyta biomass (um3/L)
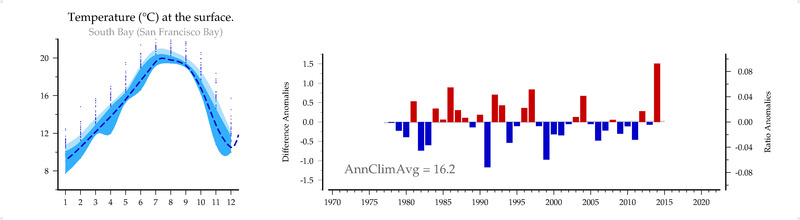
Temperature ( C ) at the surface.
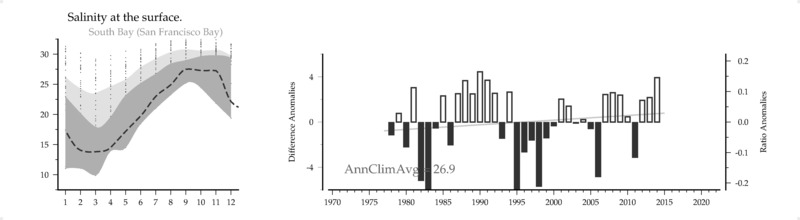
Salinity () at the surface.
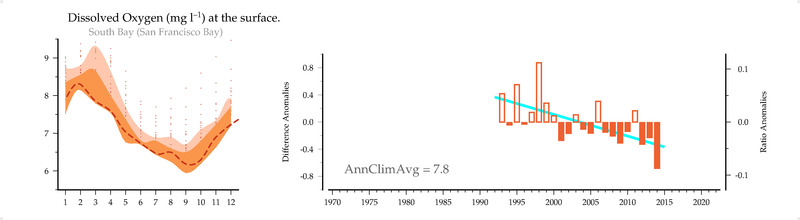
Dissolved Oxygen (mg/L) at the surface.
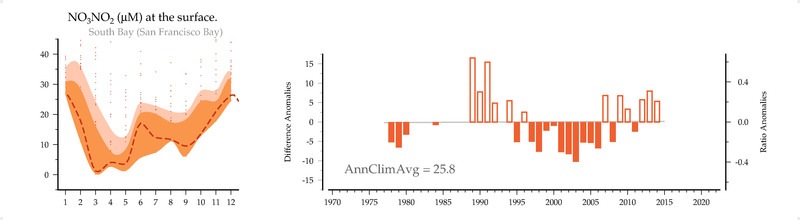
NO3NO2 (uM) at the surface.
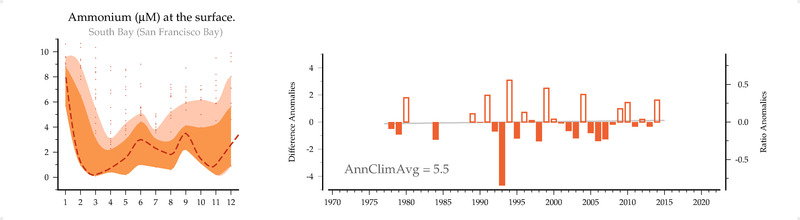
NH4 (uM) at the surface.
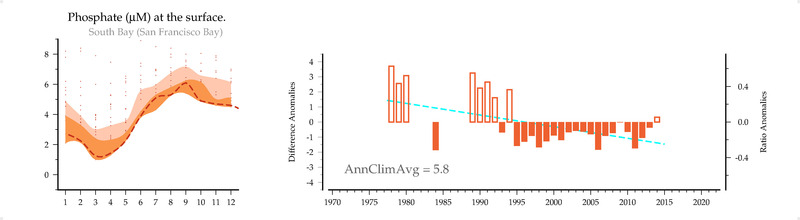
PO4 (uM) at the surface.
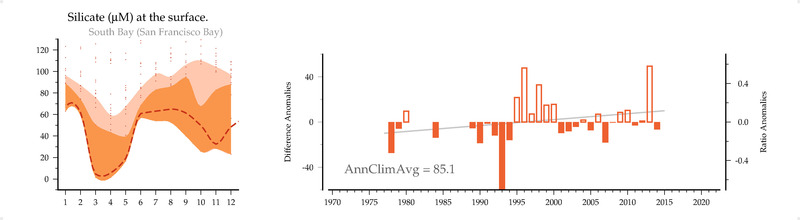
SiO4 (uM) at the surface.
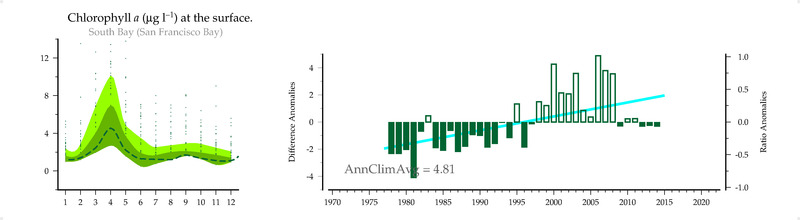
Chlorophyll a (ug/L) at the surface.
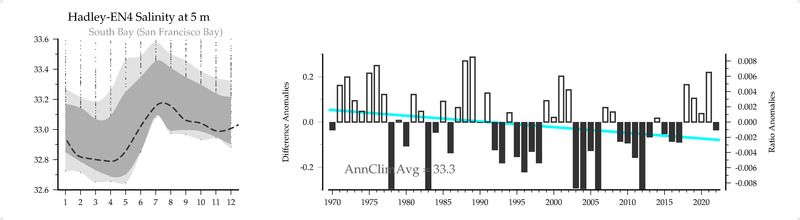
Hadley-EN4 Salinity () at 5 m
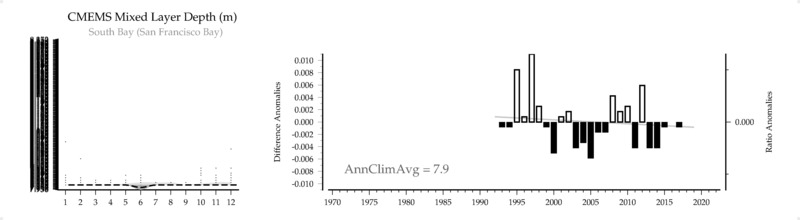
CMEMS Mixed Layer Depth (m)
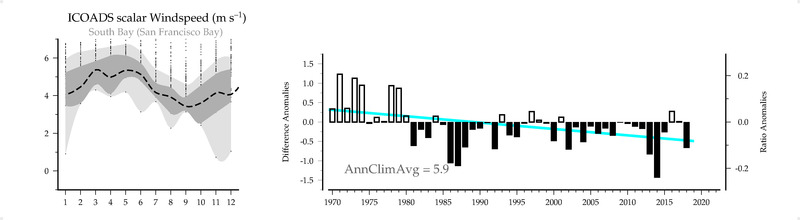
ICOADS scalar Windspeed (m/s)
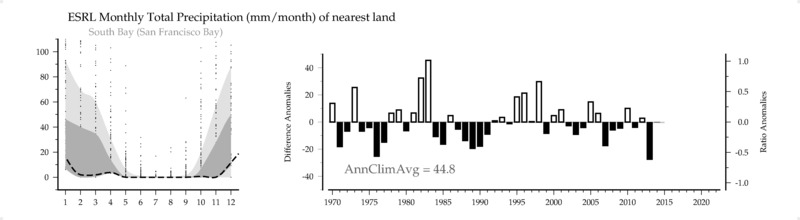
ESRL Monthly Total Precipitation (mm/month) of nearest land
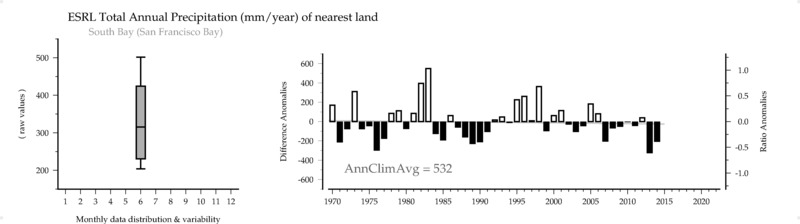
ESRL Total Annual Precipitation (mm/year) of nearest land
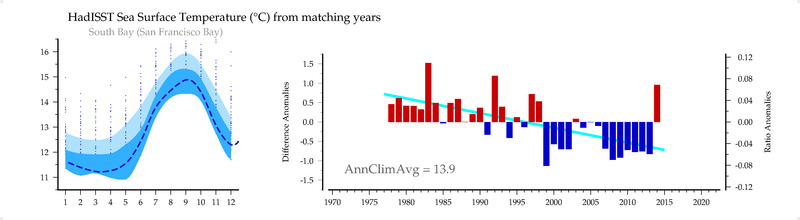
HadISST Sea Surface Temperature (C) from matching years
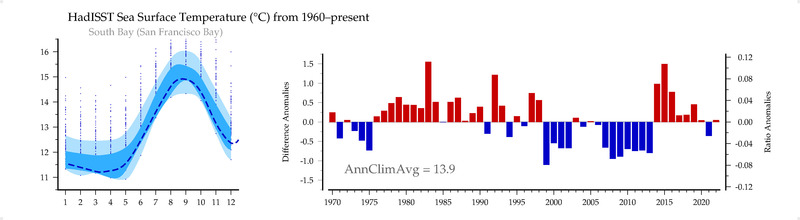
HadISST Sea Surface Temperature (C) from 1960-present
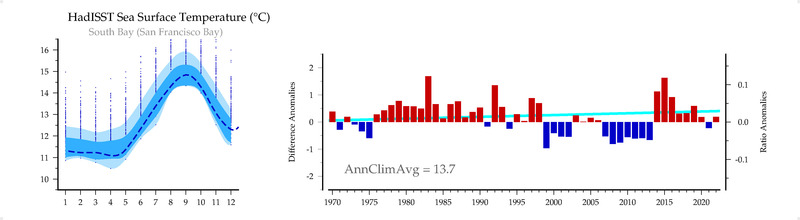
HadISST Sea Surface Temperature (C)