Multi-Variable Comparison & Correlation Plot (MVCCP)
Checked variables will have their figure shown below. Uncheck any variable to remove its plot from below.
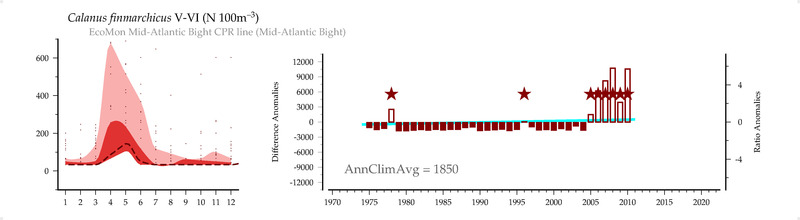
Calanus finmarchicus V-VI (#/100m3)
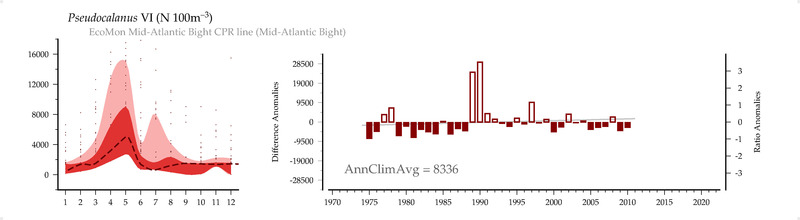
Pseudocalanus VI (#/100m3)
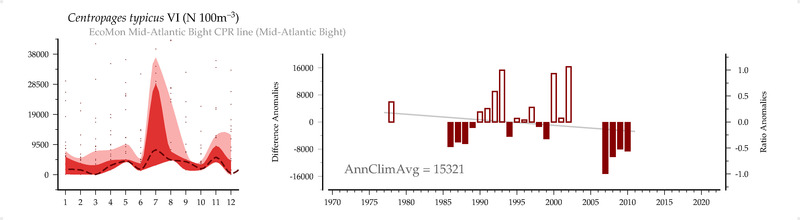
Centropages typicus VI (#/100m3)
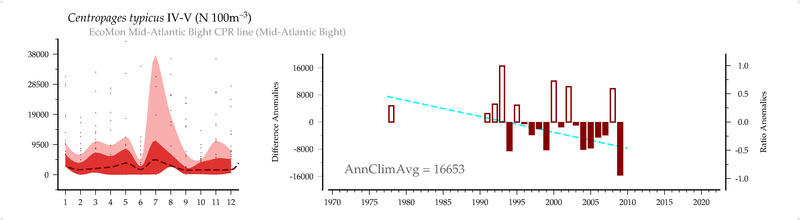
Centropages typicus IV-V (#/100m3)
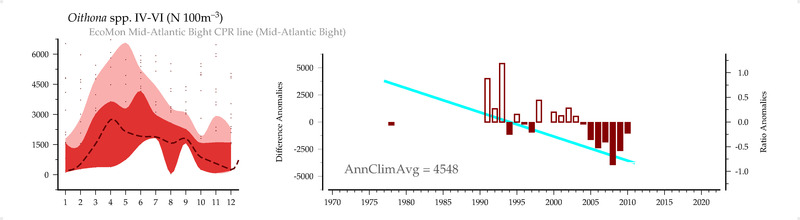
Oithona spp. IV-VI (#/100m3)
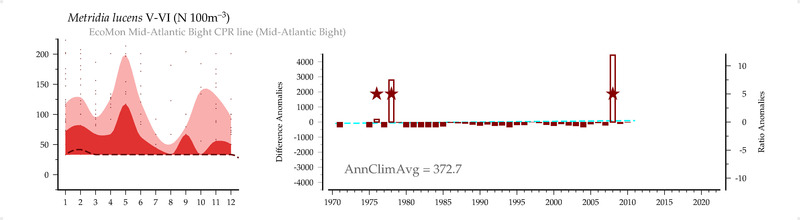
Metridia lucens V-VI (#/100m3)
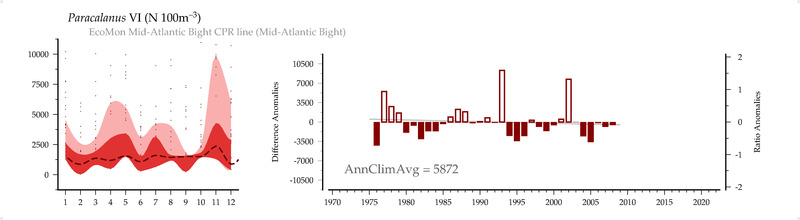
Paracalanus VI (#/100m3)
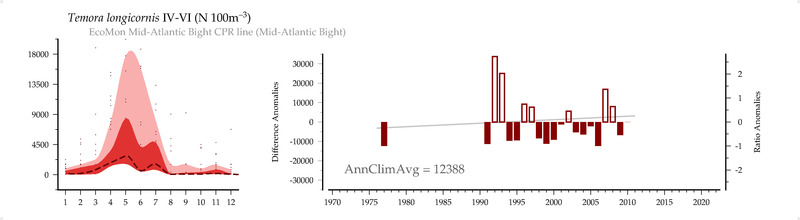
Temora longicornis IV-VI (#/100m3)
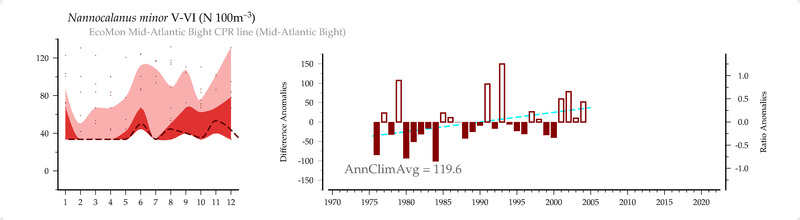
Nannocalanus minor V-VI (#/100m3)
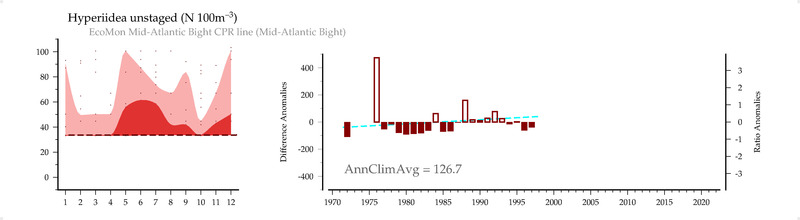
Hyperiidea unstaged (#/100m3)
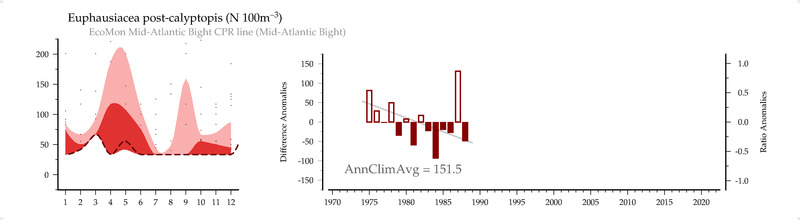
Euphausiacea post-calyptopis (#/100m3)
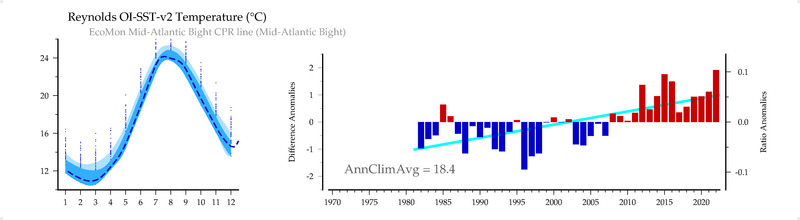
Reynolds OI-SST-v2 Temperature (C)
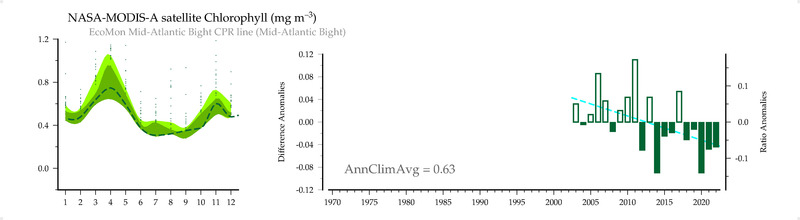
NASA-MODIS-A satellite Chlorophyll (mg/m3)
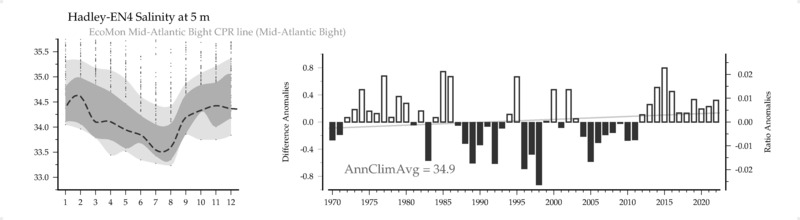
Hadley-EN4 Salinity () at 5 m
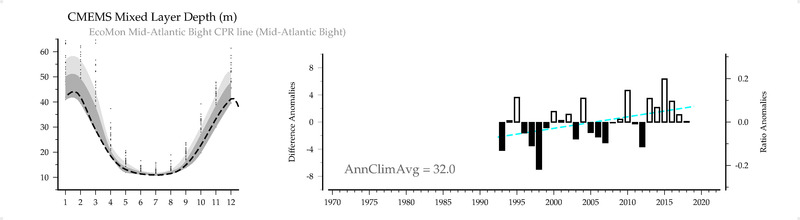
CMEMS Mixed Layer Depth (m)
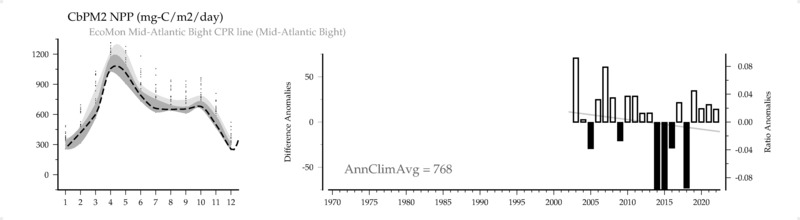
CbPM2 NPP (mg-C/m2/day)
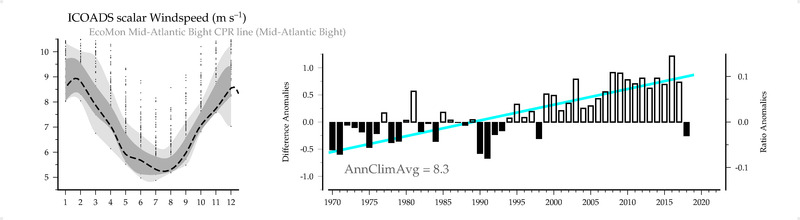
ICOADS scalar Windspeed (m/s)
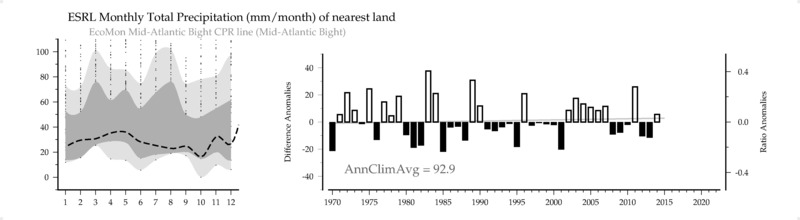
ESRL Monthly Total Precipitation (mm/month) of nearest land
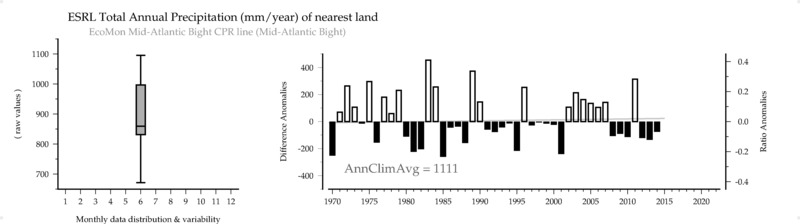
ESRL Total Annual Precipitation (mm/year) of nearest land
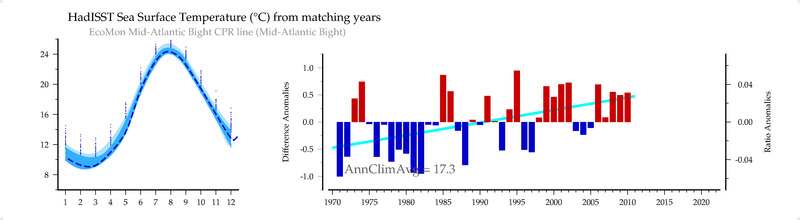
HadISST Sea Surface Temperature (C) from matching years
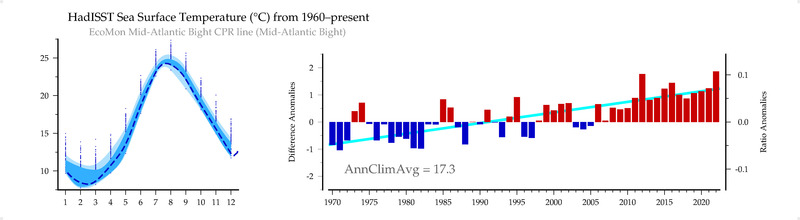
HadISST Sea Surface Temperature (C) from 1960-present
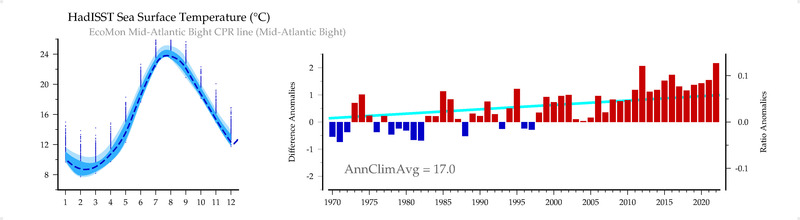
HadISST Sea Surface Temperature (C)